Figure 1.

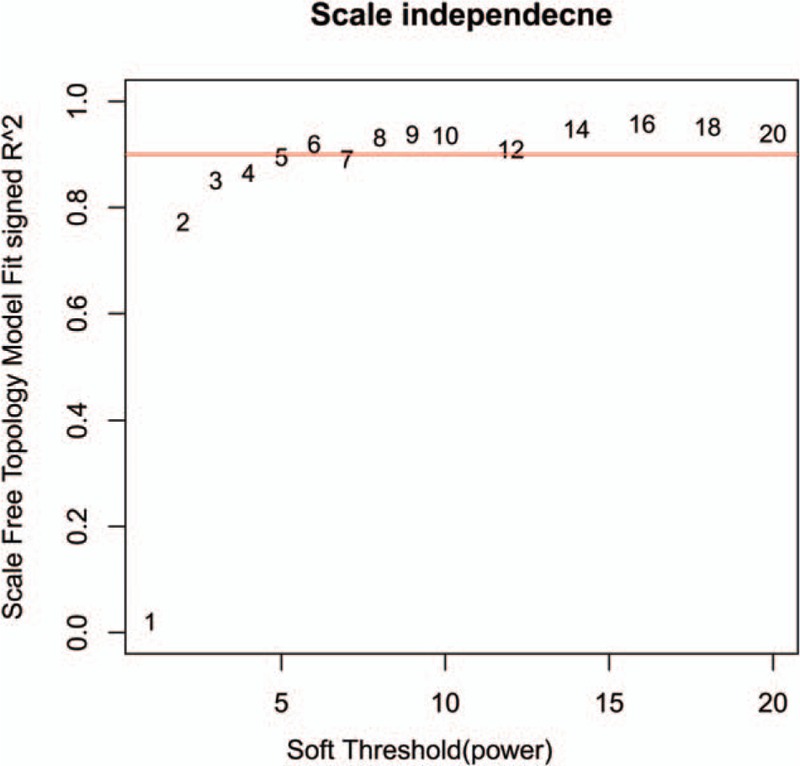
Power value for the adjacency matrix in weighted gene coexpression network analysis. The red line signals 0.9 on the vertical axis.

Power value for the adjacency matrix in weighted gene coexpression network analysis. The red line signals 0.9 on the vertical axis.