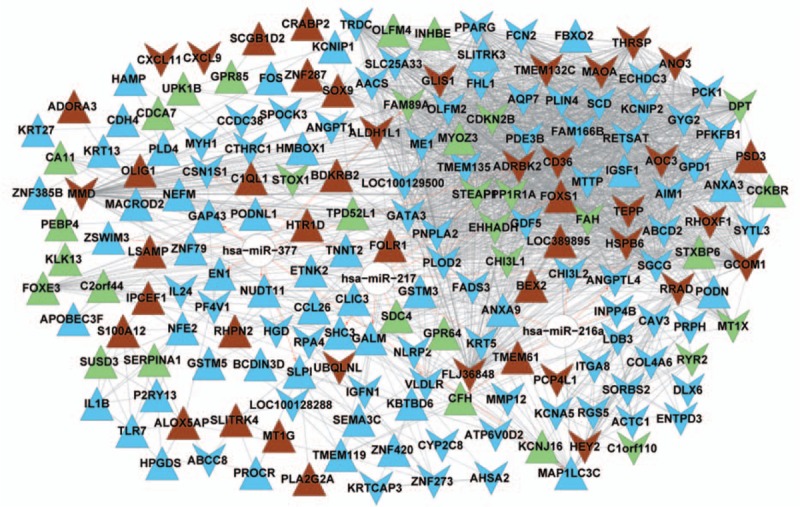
Figure 4.

A miRNA–target gene network. In the network, upper triangles represent upregulated genes and downward triangles represent downregulated genes. White nodes stand for miRNAs. Blue, brown, and green nodes are genes extracted from the blue module, the brown module, and the green module, irrespectively. A dotted line suggests that the two genes are negatively correlated. A solid line suggests the positive correlation between two genes. A red arrow-headed line linking a gene and a miRNA suggests that the gene is regulated by the miRNA. miRNA = microRNA.
