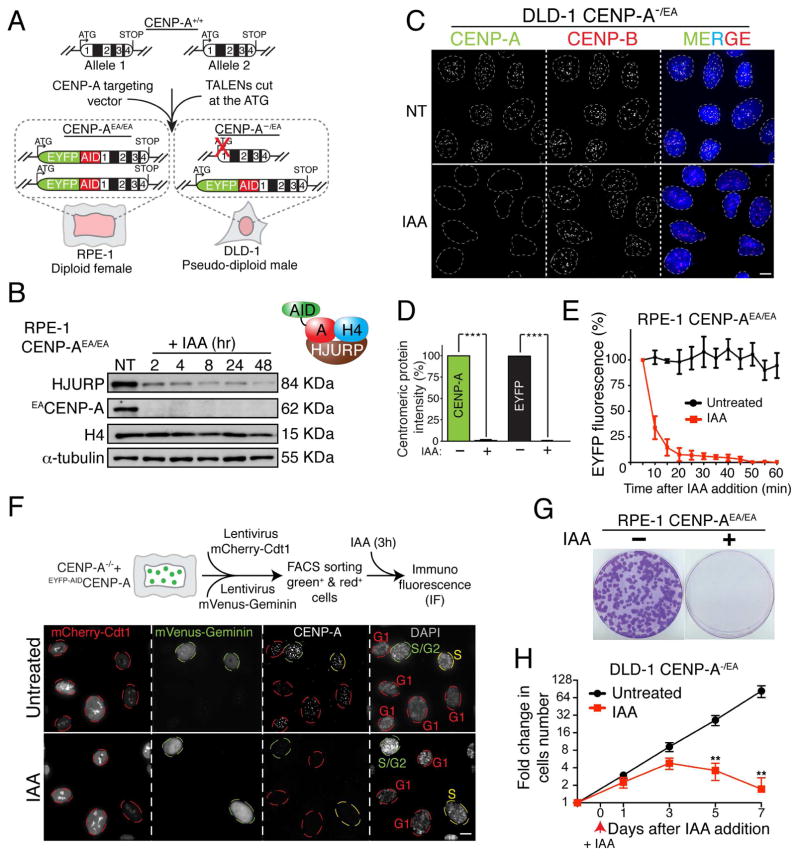
Figure 1. Complete and rapid removal of the centromere epigenetic mark CENP-A in human cells.
(A) Schematic of the TALEN-mediated genome editing to endogenously tag CENP-A with AID (A) and EYFP (E) in the indicated cell lines. Position of exons, introns and start/stop codons are indicated. (B) Immuno-blot of RPE-1 cells following treatment with Auxin (IAA) at the indicated time points (hours). α-tubulin was used as a loading control. A schematic of the soluble CENP-A-associated factors is also shown. (C) Representative immunofluorescence images on DLD-1 cells showing CENP-A depletion after 24 hours treatment with IAA. CENP-B was used to mark centromere position. (D) Quantification of the experiment in C by using an antibody against CENP-A or by monitoring EYFP intensity. Unpaired t test: *** p < 0.0001. (E) Degradation kinetics of CENP-A in RPE-1 cells with or without (+/-) IAA treatment measured by EYFP intensity during live cell imaging. IAA was added at the microscope stage. Σn = 10 cells (F) Representative images show immuno-fluorescence on RPE-1 cells expressing the cell cycle indicator FUCCI. Red (G1), yellow (S) or green (S/G2) circles indicate the cell cycle position +/− IAA treatment. A schematic of the experimental designed is also shown. (G) Images of representative crystal violet–stained colonies from the colony formation assay +/− IAA treatment in RPE-1 cells. (H) Cell counting experiment on DLD-1 CENP-A−/EA cells +/− IAA treatment. IAA was added at day 0 and kept for a maximum of 7 days. Error bars represent the SEM of five independent experiments. Unpaired t test: ** p = 0.0026. See also Supplementary Fig. S1. Scale bars = 5 um.

