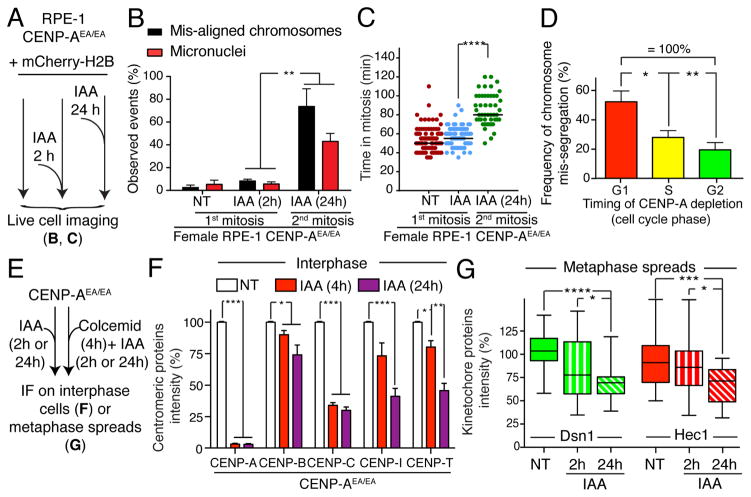
Figure 2. CENP-A is dispensable for centromere/kinetochore maintenance and chromosome segregation once centromere is assembled.
(A) Schematic of the experiments shown in B–C. (B) Bar graph shows the percentage of chromosome mis-segregation events by live cell imaging in non-treated conditions or following IAA treatment for 2 or 24 hours, respectively. Error bars represent the SEM of three independent experiments. Individual Σn = ~35 cells. Unpaired t test: ** p = 0.0099 and 0.0065. (C) Each individual point represents a single cell. Time in mitosis was defined as the period from NEBD to chromosome decondensation. Error bars represent the SEM of three independent experiments. Unpaired t test: **** p < 0.0001. (D) Bar graph shows the frequency of chromosome mis-segregation (micronuclei and mis-aligned chromosomes, 2 hour IAA treatment condition) versus the cell cycle phase in which CENP-A was depleted (determined by measuring the time required for the cells to enter into mitosis in asynchronous population, using cell co-expressing PCNAGFP as an indicator of the cell cycle or by synchronizing cell in G1 by adding IAA either at t= 0 hr or at t = 9 hr) in DLD-1 cells. Unpaired t test: * p = 0.0142, ** p = 0.0024. (E) Schematic of the experiments shown in F–G. (F) Bar graphs showing centromere intensities of CENP-A, CENP-B, CENP-C, CENP-I and CENP-T for the indicated cell line following IAA treatment. Values represent the mean of six independent experiments combining analysis performed in RPE-1 and DLD-1 cells. Individual Σn = ~30 cells, Σn = 25 centromeres per cell. Error bars represent the SEM (standard error of the mean). Unpaired t test: *** p < 0.0001, ** p < 0.07, * p < 0.05. (G) Box & whisker plots of Dsn1 or Hec1 intensities at the centromere measured on metaphase spreads. Unpaired t test: * p = 0.017, *** p = 0.0005, **** p < 0.0001. See also Supplementary Fig S2

