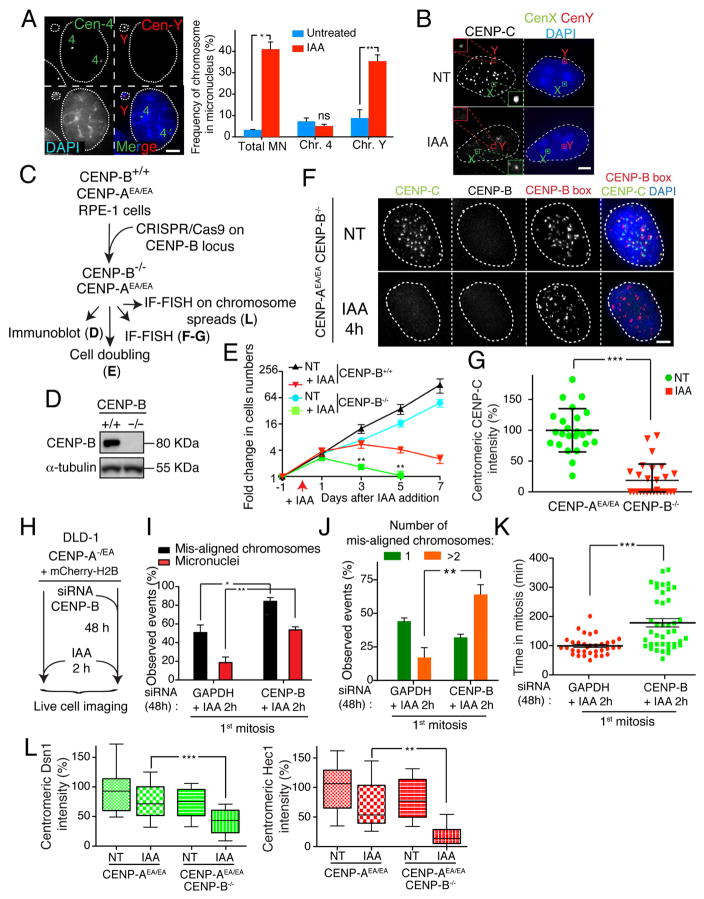
Figure 4. CENP-B is sufficient and essential to maintain kinetochore assembly and consequently faithful chromosome segregation in the absence of CENP-A.
(A) (left) Representative images show a micronucleus containing the Y chromosome by dual FISH analysis. (Right) Graphs show the frequency of micronuclei formation (X axis) versus the frequency of a micronucleus containing the chromosome Y or chromosome 4 +/− IAA treatment for 24 hours. n = ~400 cells. Unpaired t test: * p = 0.01, ** p = 0.0094 (B) Representative images of an immuno-fluorescence coupled with FISH showed CENP-C binding to centromere on the Y or X chromosome +/− IAA treatment for 24 hours. Scale bar = 5 μm. (C) Schematic of the experimental design shown in D-G. (D) Immuno-blot shows depletion of endogenous CENP-B using the CRISPR technology. α-tubulin was used as a loading control. (E) Cell counting experiment on RPE-1 +/− IAA treatment and/or CENP-B gene. IAA was added at day 0 and kept for a maximum of 7 days. Error bars represent the SEM of four independent experiments. Unpaired t test: ** p = 0.0043; 0.0016. (F) Representative immuno-fluorescence FISH to measure CENP-C levels following CENP-A depletion (by IAA) in CENP-B depleted cells. A FISH probe against CENP-B boxes was used to mark centromere position. (G) Quantification of the experiment show in D. Each dot represents an average of 25 centromeres in a single cell. Unpaired t test: *** p < 0.0001 (H) Schematic of the experiments shown in I–K. (I) Bar graph shows the percentage of chromosome mis-segregation events observed by live cell imaging following siRNA depletion of GAPDH or CENP-B and IAA treatment for 2 hours, respectively. Error bars represent the SEM of three independent experiments. Individual Σn = ~60 cells. Unpaired t test: * p = 0.02, ** p = 0.0068 (J) Bar graph shows the number (1 or >2) of mis-aligned chromosomes in percentage from analysis in E. Error bars represent the SEM of three independent experiments. Unpaired t test: ** p = 0.0093. (K) Scatter plot graph shows the time in mitosis (from NEBD to chromosome decondensation). Each individual point represents a single cell. Error bars represent the SEM of three independent experiments. Unpaired t test: *** p < 0.0001. (L) Box & whisker plots of Dsn1 and Hec1 intensities at the centromere measured on metaphase spreads. Unpaired t test: ** p = 0.002, *** p = 0.0005. See also Supplementary Fig S3 and S4. Scale bars = 5 μm.

