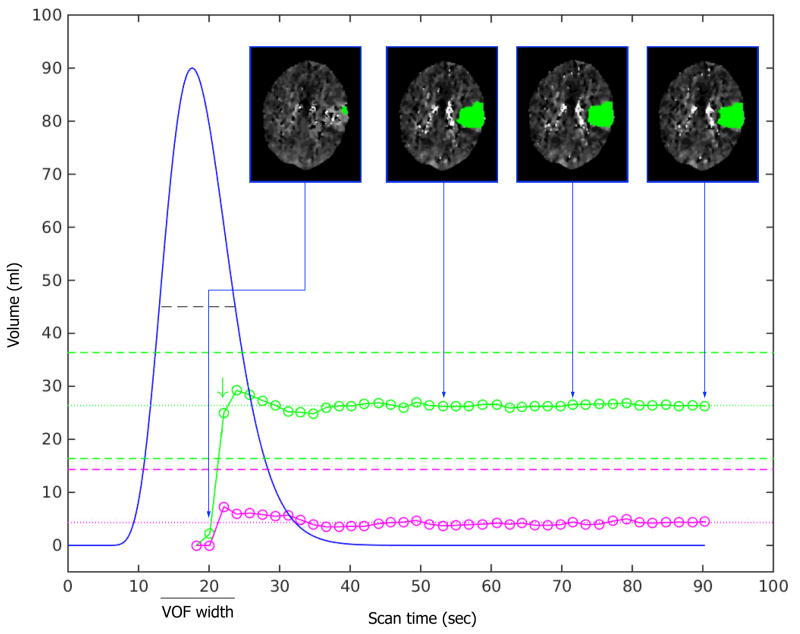
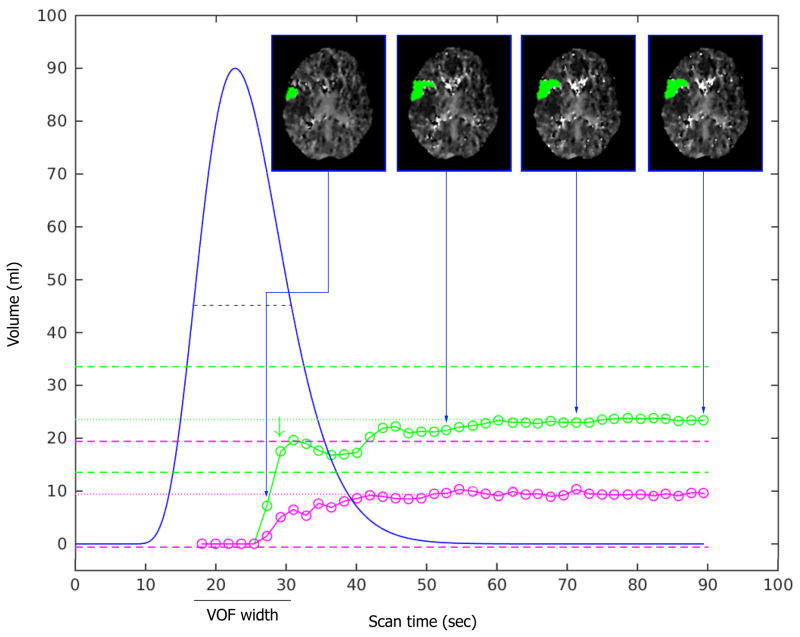
Figure 1. Relationship between scan duration (seconds) and ischemic lesion volume (ml) estimates.
The VOF curve fit is shown as a blue curve. The volume estimates of critically hypoperfused tissue (Tmax>6s) are indicated with green circles. The dotted green line represents the mean volume of the Tmax>6 lesion for the last 6 frames (the “stability tail”). The dashed green lines represent the boundaries (mean volume ±10ml) beyond which the lesion volumes are deemed unreliable. For the scan shown in panel A, the Tmax>6s lesion volume estimate (green circles) is essentially unaffected by reductions in scan time from 90s down to 38s. With further reductions in scan time down to 23s (corresponds with the optimal scan time, green arrow), some fluctuations in the Tmax>6s lesion volume estimates is observed. When scan time is reduced below 23s, the Tmax>6s lesion volume estimate drops to nil and is clearly unreliable. A similar pattern is observed for the volume estimates of the ischemic core (rCBF<30%, pink circles), although no optimal scan time is noted given the comparatively small size of the ischemic core. The insets show axial CTP images corresponding to four select scan durations. The insets illustrate the marginal differences in lesion volume and lesion morphology when the scan time exceeds the optimal scan duration, but dramatic changes in lesion volume when the scan is shorter than its optimal duration. The graphs in Panel B show the same pattern as in panel A, but due to a later bolus arrival time (T0) and a wider VOF, the graphs of the ischemic lesion volume estimates and the optimal scan duration are shifted to the right.


