
Figure 1. Generating a Mitochondrial Sirtuin interactome.
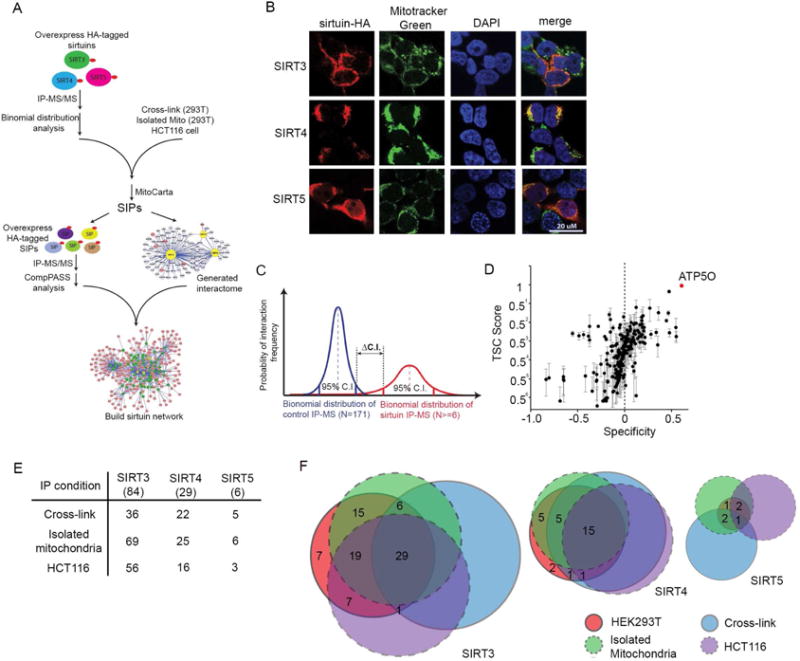
(A) Workflow. SIRT3-5-HA or mtDSRED-HA constructs were stably overexpressed in 293T cells. Following IP-MS experiments (n=6–9), sirtuin interacting proteins, termed SIPs, were determined. After validation by IHC, 81 baits were stably expressed in 293T cells with a C-terminal HA tag, and a second round of IP-MS experiments were performed to build the mitochondrial sirtuin interaction network.
(B) Subcellular localization of SIRT3-5HA was determined by immunohistochemistry of HA-tagged sirtuins and co-localization with Mitotracker Green. DAPI staining indicates nuclei.
(C) SIPs were identified using an IP-MS dataset from 171 unrelated IPs as a negative control. The binomial distribution of each mitochondrial sirtuin interacting protein was calculated from: 1) control sirtuin unrelated IP-MS datasets (blue line), and 2) sirtuin IP-MS datasets (red line). SIPs were considered specific when the 95% confidence interval for control IPs and sirtuin IP-MS data did not overlap.
(D) Representative SIRT3 IP-MS data from 293T cells plotted as total spectral count (TSC) and specificity of SIRT3 interacting proteins. ATP5O is indicated by a red dot. Error bars indicate standard error (n=9 individual IPs).
(E) Overlap in 84 SIRT3, 30 SIRT4 and 6 SIRT5 interacting proteins comparing IPs from HEK293T whole cell lysates (n=6–9) with interacting proteins identified from: HEK293T whole cell lysates after chemical crosslinking with DTBP (Cross-link, n=5), HEK293T isolated mitochondria (isolated mitochondria, n=3), or HCT116 whole cell lysates (HCT116, n=3).
(F) Venn Diagram comparing the sirtuin specific interacting proteins from HEK293T whole cell lysates (pink; as described in panel A) with overlapping interacting proteins obtained from isolated mitochondria (green), HEK293T cells crosslinked with DTBP (blue), and from HCT116 whole cell lysates (purple).
See also Figure S1 and Table S1–S4