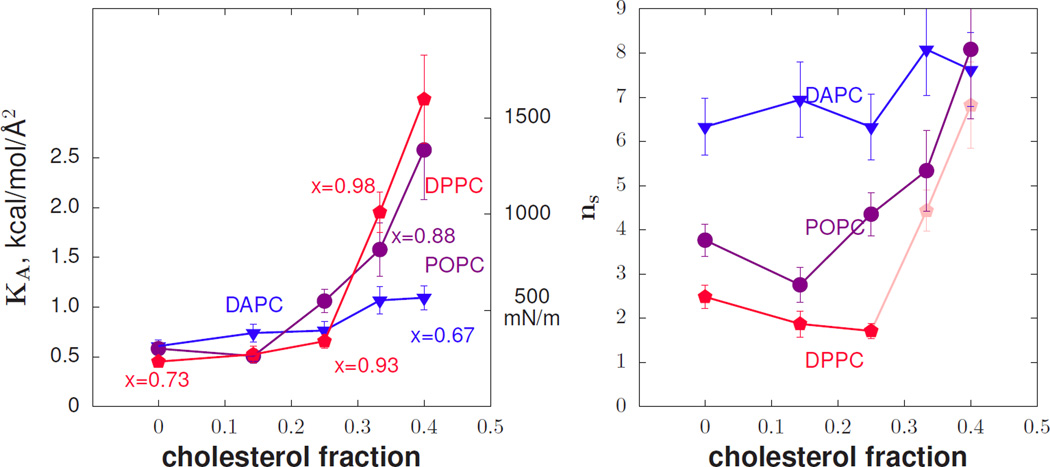
FIG. 2.
At left, the area compressibility modulus versus cholesterol mole fraction from simulation. Selected points are labeled with their chain extension values x as defined in the text. At right, the number of independent effective polymer segments, ns, versus cholesterol mole fraction. Values for DPPC past 0.25 mole fraction cholesterol are dimmed because the Gaussian approximation for the free energy is likely no longer valid in these highly constrained environments.

