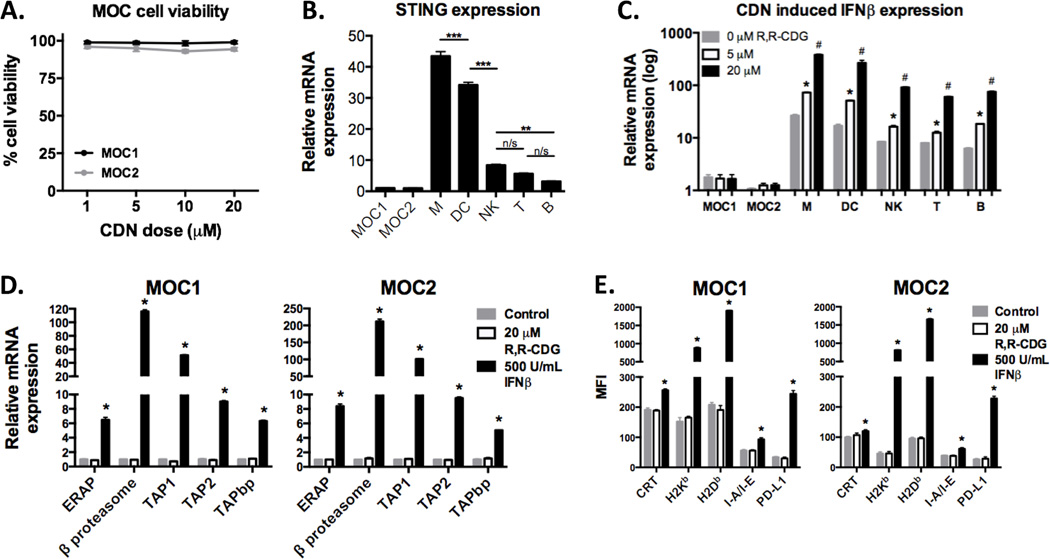
Figure 3. Type I IFN produced following CDN activation of immune cell STING enhances immunogenicity of MOC tumor cells in vitro.
A, XTT assays (48 hour time point) were used to assess MOC1 or MOC2 cell viability following exposure of up to 20 µM R,R-CDG. Similar results were seen for at 24 and 72 hours (data not shown). B, RT-PCR was used to demonstrate baseline STING expression in MOC and sorted immune cells (CD11b+ myeloid cells, M; CD11c+ dendritic cells, DC; NK1.1+ natural killer cells, NK; CD3+ T lymphocytes, T; CD19+ B lymphocytes, B; from spleens and lymph nodes of WT B6 mice) with expression relative to MOC1. **, P < 0.01; ***, P < 0.001; ANOVA. C, MOC or sorted immune cells were stimulated with 0, 5 or 20 µM R,R-CDG for 12 hours and quantification of IFNβ transcripts were determined relative to baseline MOC1. *, P < 0.05 relative to untreated; #, P < 0.01 (ANOVA) relative to untreated and 5 µM R,R-CDG treated cells. Similar results were observed for IFNα production (data not shown). D, Expression of transcripts of antigen processing machinery components were quantified relative to untreated groups following treatment with R,R-CDG or IFNβ for 24 hours. *, P < 0.01 (ANOVA) relative to untreated and R,R-CDG treated cells. E, Flow cytometry was used to assessed MOC cell surface expression of calreticulin (CRT), MHC class I (H2-Kb and H2-Db), MHC class II (I-A/I-E), and PD-L1 at baseline and following treatment with R,R-CDG or IFNβ for 48 hours. *, P < 0.01 (ANOVA) relative to untreated and R,R-CDG treated cells. Results shown are from at least two independent experiments, each performed in at least technical triplicate. n/s, non-significant.

