Figure 5.

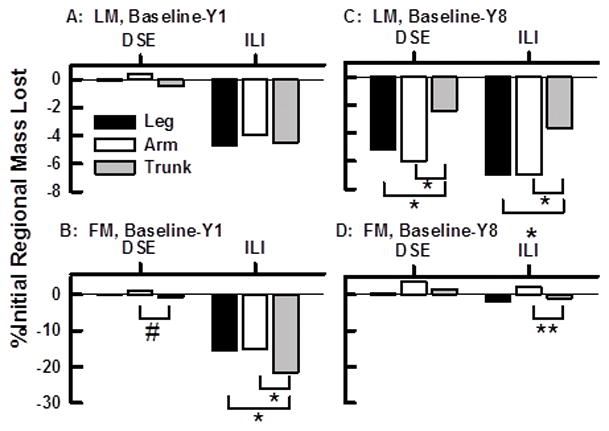
Percent Changes in Regional LM and FM between Baseline and Years One and Eight Among Males within the DSE (C) and ILI (I) Groups. A–C, FM Changes; D–F, LM Changes. Other details in Figure 3 legend.

Percent Changes in Regional LM and FM between Baseline and Years One and Eight Among Males within the DSE (C) and ILI (I) Groups. A–C, FM Changes; D–F, LM Changes. Other details in Figure 3 legend.