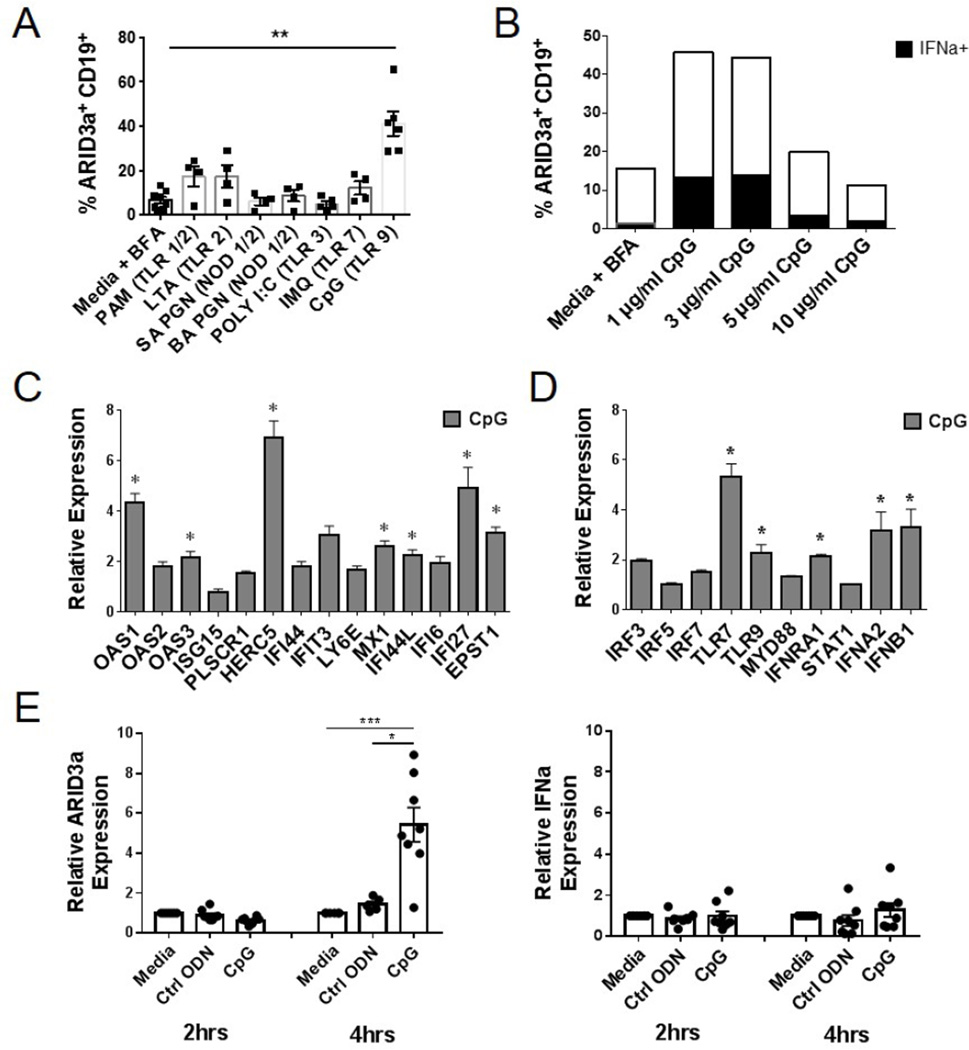
Figure 4. Healthy control B cells express ARID3a upon stimulation via TLR 9.
A) Flow cytometry was used to assess percentages of ARID3a+ CD19+ B cells from 4–6 healthy controls after stimulation (18–24 hrs) with PAM, LTA, SA PGN, BA PGN, Poly I:C, IMQ, and CpG. Means, standard errors and significance (Paired T test, **p< 0.01) are shown. B) Representative percentages of ARID3a+ and IFNa-expressing B cells in response to increasing concentrations of CpG are indicated. C) Biomark HD qRT-PCR analyses of CD20+ B cells from CpG-treated (n=3) and unstimulated (n=3) control samples were assessed for IFN signature and D) TLR pathway-associated genes. All genes were normalized to HPRT1. Means, standard errors and significance of genes upregulated > 2-fold by Student’s T test (*p< 0.05) are shown. E) Healthy control B cells stimulated with ODN control or CpG were evaluated for ARID3a and IFNa transcription via qRT-PCR at 2 and 4 hours compared to media controls. Symbols are independent values determined from two individuals. Student’s T test (*p< 0.05, ***p=0.0007)

