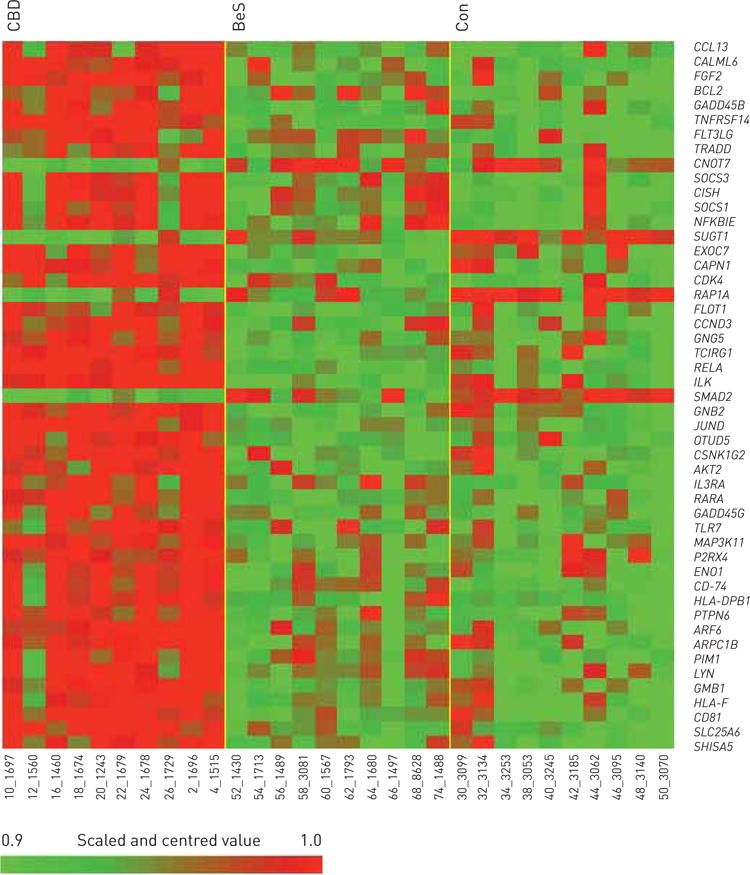
FIGURE 2.

Heatmap representing expressing profiles of beryllium-stimulated beryllium sensitisation (BeS), chronic beryllium disease (CBD) and control (Con) peripheral blood mononuclear cells determined by microarray analysis. Red indicates increased expression; green indicates decreased expression relative to the nonfailing population mean. Gradients indicate the level of gene expression change over time. Data range before thresholding: −2.7 to 2.9.
