
FIGURE 4.
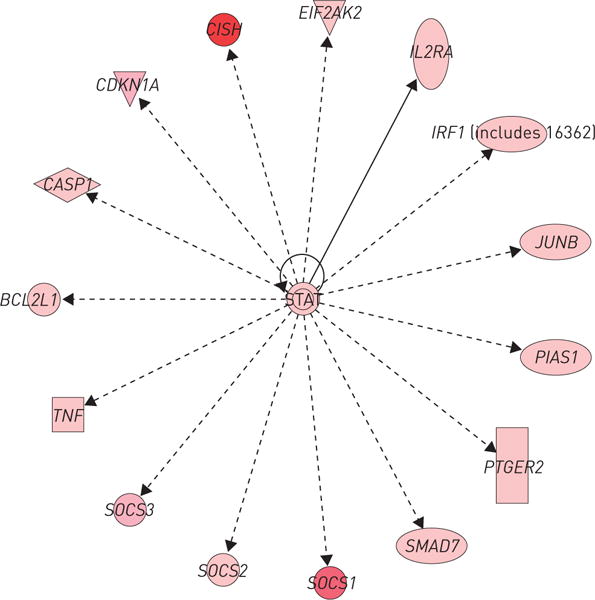
Ingenuity Pathway Analysis of the top overlapping networks in chronic beryllium disease and sarcoidosis. The network is displayed graphically as nodes (genes/gene products) and edges (biological relationship between nodes). The node colour intensity indicates the fold change expression of genes (red representing upregulation).