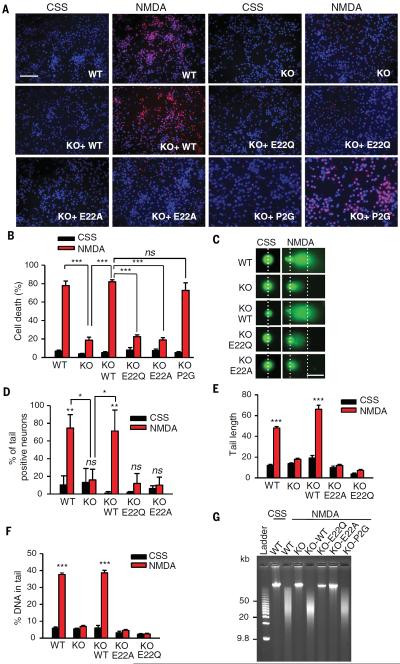
Fig. 6. MIF nuclease activity is critical for DNA damage and PARP-1–dependent cell death in cortical neurons.
(A) Representative images and (B) quantification of NMDA-induced (500 μM for 5 min) excitotoxicity in MIF WT, KO, and KO cortical neurons expressing MIF WT, E22Q, E22A, or P2G. Scale bar, 200 μm. (C) Representative images and (D to F) quantification of NMDA-induced DNA damage 6 hours after treatment determined by the comet assay in MIF WT, KO, and KO neurons expressing MIF WT, E22Q, E22A, or P2G. Dashed lines indicate the center of the head and tail. Scale bar, 20 μm. (G) Pulsed-field gel electrophoresis assay of NMDA-induced DNA damage 6 hours after treatment in MIF WT and KO neurons and KO neurons expressing MIF WT, E22Q, E22A, or P2G. Means ± SEM are shown in (B), (D), (E), and (F). *P < 0.05, **P < 0.01, ***P < 0.001, one-way ANOVA; ns, nonsignificant.

