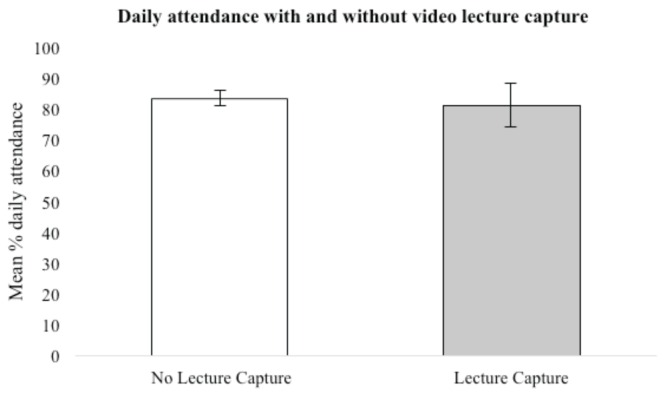
FIGURE 1.
Comparison of daily class attendance during semesters when video lecture capture was available and was not available to the students. The mean percentage of daily attendance was calculated across four semesters of a general microbiology course before lecture capture videos were available to the students (83 ± SD) and across six semesters after video lecture capture became available (81 ± SD). Course enrollment ranged from 64 to 139 students (mean = 101 students); 1,014 total students. SD = standard deviation.

