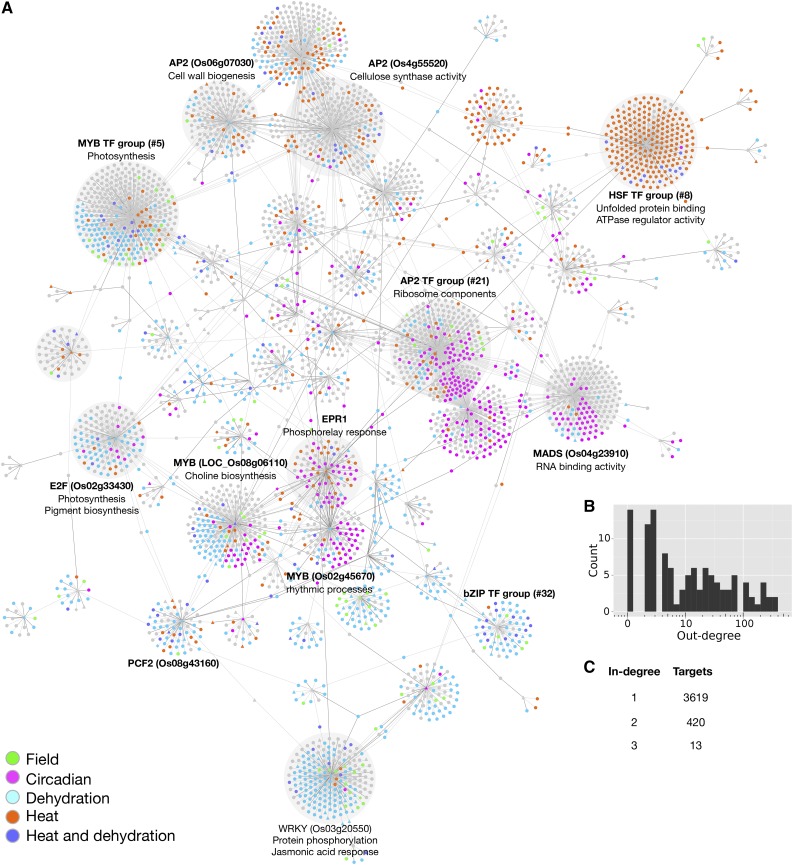
Figure 6.
Gene Regulatory Network for Rice Leaves across Environmental Conditions.
(A) The inferred network. TFs are noted with triangles; other genes are noted with circles. The colors indicate the conditions in which the genes were differentially expressed.
(B) Histogram of TF out-degree frequency.
(C) Table of target in-degree frequency.

