Figure 2.
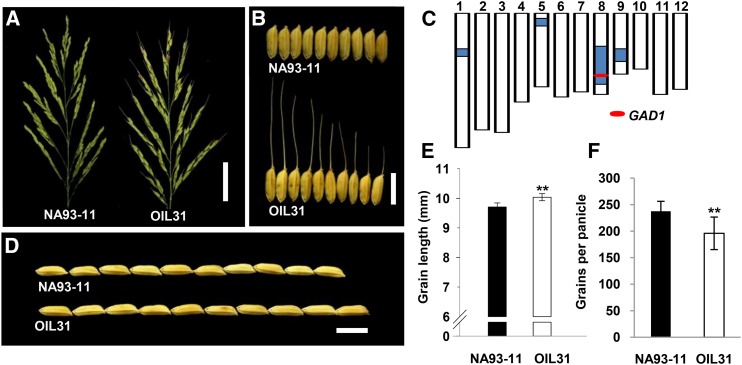
Phenotypes of NA93-11 and OIL31.
(A) Panicle comparison between NA93-11 and OIL31. Bar = 50 mm.
(B) Grains of NA93-11 and OIL31. Bar = 10 mm.
(C) Genotype of OIL31. The white regions indicate the NA93-11 genetic background. The blue regions indicate wild rice introgressions. The red ellipse indicates the GAD1 locus.
(D) and (E) Grain length comparison between NA93-11 and OIL31. Bar = 10 mm.
(F) Comparison of grain number per panicle between NA93-11 and OIL31.
Sample sizes were n = 20. The statistical significance was set at P < 0.05 based on a two-tailed Student’s t test. Error bars represent the sd.

