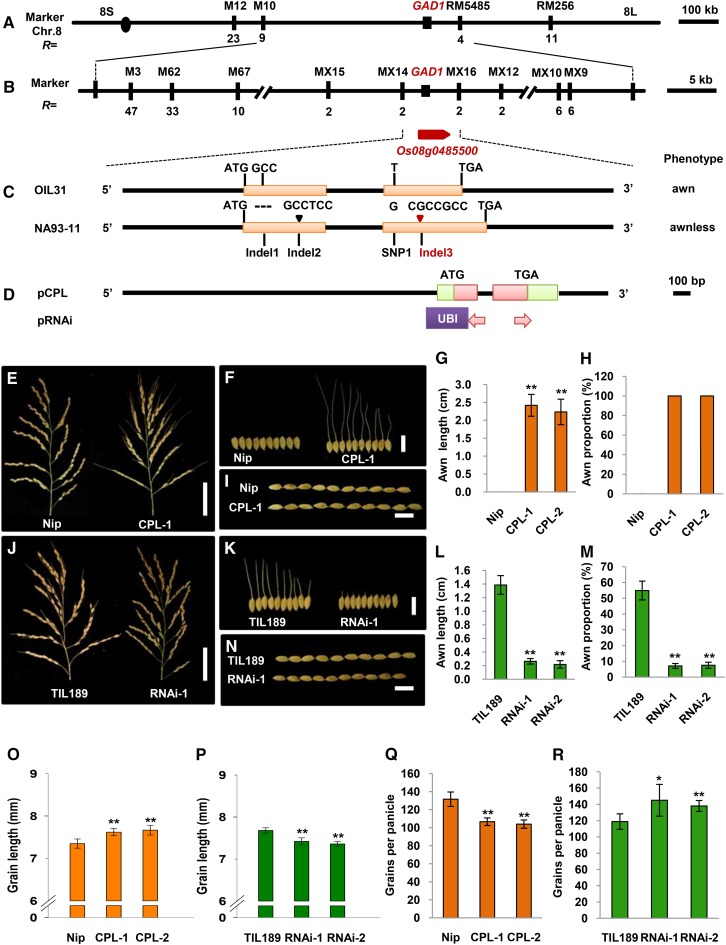
Figure 3.
Map-Based Cloning of GAD1.
(A) The target gene was mapped between the markers M10 and RM5485 on the long arm of chromosome 8. The numbers underneath the bars indicate the number of recombinants between GAD1 and the molecular markers.
(B) GAD1 was fine mapped to an ∼6-kb region between the markers MX14 and MX16. The numbers underneath the bars indicate the numbers of recombinants between GAD1 and molecular markers. Os08g0485500 was the candidate gene. The arrow indicates gene direction.
(C) Gene structure of GAD1 and the different sites between OIL31 and NA93-11. The black bars represent 5′ upstream and 3′ downstream regions and introns; rectangles represent exons; and triangles represent insertions. There were three Indels (Indel1, Indel2, and Indel3) and an SNP (SNP1) between OIL31 and NA93-11.
(D) The constructs used in the GAD1 functional investigation. pCPL represents the ∼4.0-kb W2014 genomic fragment covering the entire GAD1 gene region and the 2.5-kb 5′ upstream and 350-bp 3′ downstream sequences used for the complementation test. pRNAi denotes the RNAi construct that harbors a 350-bp specific region of the GAD1 mRNA. UBI is a maize Ubiquitin promoter. Green areas represent the 5′ and 3′ untranslated regions; red areas represent gene coding regions.
(E) Panicle comparison between Nipponbare (Nip) and the transgenic line (CPL-1). Bar = 50 mm.
(F) Grain comparison between Nip and the transgenic line (CPL-1). Bar = 10 mm.
(G) Awn length comparison between Nip and two independent transgenic lines, CPL-1 and CPL-2.
(H) The comparison of percentages of awned seeds between Nip and two independent transgenic lines, CPL-1 and CPL-2.
(I) and (O) Grain length comparison between Nip and transgenic lines, CPL-1 and CPL-2. Bar = 10 mm.
(J) Panicle comparison between a control plant (TIL189) and a transgenic line (RNAi-1). Bar = 50 mm.
(K) Grain comparison between TIL189 and a transgenic line (RNAi-1). Bar = 10 mm.
(L) Awn length comparison between TIL189 and two independent transgenic lines, RNAi-1 and RNAi-2.
(M) The comparison of percentages of awned seeds between TIL189 and two independent transgenic lines, RNAi-1 and RNAi-2.
(N) and (P) Grain length comparison between TIL189 and RNAi transgenic lines, RNAi-1 and RNAi-2. Bar = 10 mm.
(Q) Grain number per panicle comparison between Nip and two independent transgenic lines, CPL-1 and CPL-2.
(R) Grain number per panicle comparison between TIL189 and two independent transgenic lines, RNAi-1 and RNAi-2.
Sample sizes were n = 10. The statistical significance was set at P < 0.05 based on a two-tailed Student’s t test. Error bars represent the sd.

