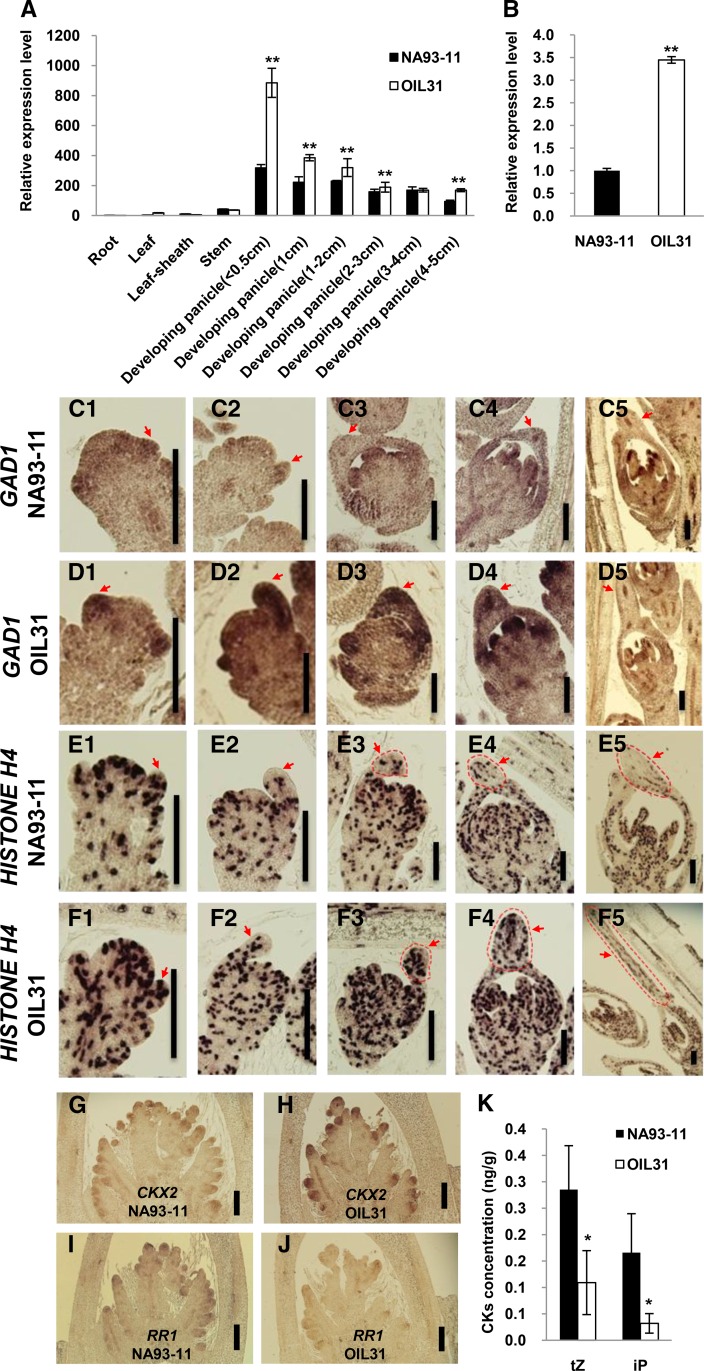
Figure 4.
The Expression Patterns and Effects of GAD1 on Spikelet Development.
(A) Comparison of GAD1 expression patterns between NA93-11 and OIL31.
(B) Comparison of GAD1 expression levels of at the apices of glumes between NA93-11 and OIL31.
(C1) to (C5) RNA in situ hybridization of GAD1 during spikelet development in NA93-11. Bar = 100 μm.
(D1) to (D5) RNA in situ hybridization of GAD1 during spikelet development in OIL31. Bar = 100 μm.
(E1) to (E5) RNA in situ hybridization of HISTONE H4 during spikelet development in NA93-11. Bar = 100 μm.
(F1) to (F5) RNA in situ hybridization of HISTONE H4 during spikelet development in OIL31. Bar = 100 μm.
(G) RNA in situ hybridization of CKX2 in a young panicle of NA93-11. Bar = 100 μm.
(H) RNA in situ hybridization of CKX2 in a young panicle of OIL31. Bar = 100 μm.
(I) RNA in situ hybridization of RR1 in a young panicle of NA93-11. Bar = 100 μm.
(J) RNA in situ hybridization of RR1 in a young panicle of OIL31. Bar = 100 μm.
(K) Comparison of cytokinin concentrations in 5- to 10-mm-long young panicles between NA93-11 and OIL31.
Red arrows (and red dashed lines in [E3] to [E5] and [F3] to [F5]) indicate the tips of lemmas. The statistical significance was set at P < 0.05 based on a two-tailed Student’s t test. Error bars represent the sd. In (A), (B), and (K), the data represent the average of three independent biological replicates.

