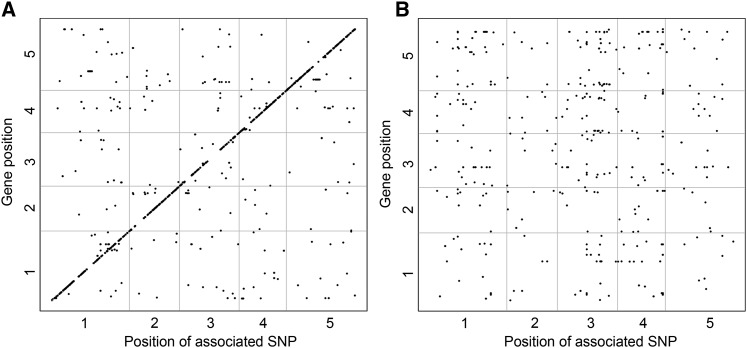
Figure 4.
Overview of eGWAS Results.
The scatterplots show for each gene (positions on y axes) the SNPs that associate with treatment-independent expression (common test; [A]) and SNPs that associate with treatment-dependent expression (trait-specific test; [B]). SNPs were considered to be in trans at a threshold of 5 kb from the transcription start and stop site.

