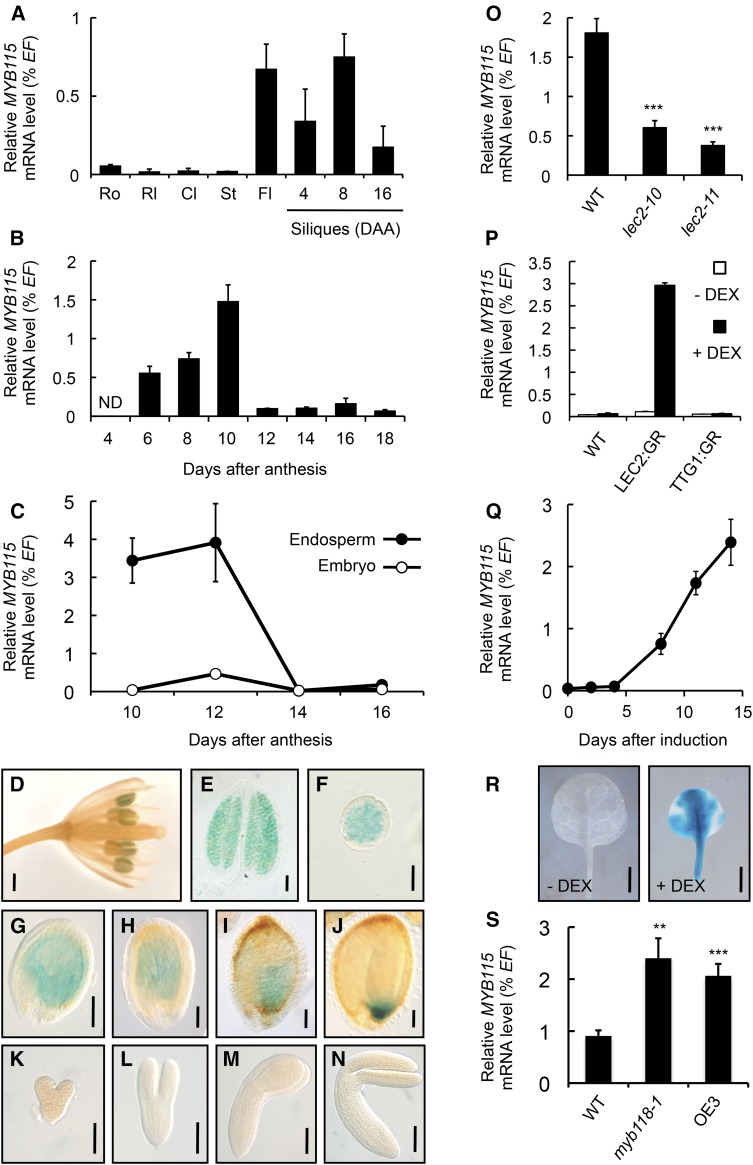
Figure 1.
Expression Pattern and Transcriptional Regulation of MYB115.
(A) to (C) Analysis of relative mRNA accumulation of MYB115 was performed in different plant organs (A), in developing seeds (B), and in developmental series of endosperm and embryo fractions (C). The results obtained are standardized to the EF1αA4 (EF) gene expression level. Values are the means and se of three to six replicates performed on cDNA dilutions obtained from three independent mRNA extractions. Cl, cauline leaves; Fl, flowers; ND, not detected; Rl, rosette leaves; Ro, roots; St, stems.
(D) to (N) Pattern of activity of the ProMYB115:uidA cassette in flowers (D), in stamens (E), in pollen grains (F), in developing seeds harvested 6 (G), 8 (H), 10 (I), or 12 (J) DAA, and in early maturing embryos harvested 6 (K), 8 (L), 10 (M), or 12 (N) DAA. For histochemical detection of GUS activity, tissues were incubated overnight in a buffer containing 0.2 mM each of potassium ferrocyanide and potassium ferricyanide. The results for GUS activity were observed on whole-mounted inflorescences; microscopy observations of stamens, pollen grains, seeds, and excised embryos were performed using Nomarski optics. Bars = 1 mm in (D), 50 μm in (E), 20 μm in (F), 100 μm in (G) to (J), and 50 μm in (K) to (N).
(O) Accumulation of MYB115 mRNA in lec2 mutant seeds was quantified 10 DAA by RT-qPCR and presented as the percentage of the EF1αA4 (EF) gene expression. Values are the means and se of three to six replicates performed on three independent cDNA preparations obtained from batches of seeds dissected from four to five siliques. The three silique sets were harvested on distinct individuals. Asterisks indicate significant difference from the wild type according to t test, ***P < 0.001.
(P) Accumulation of MYB115 mRNA in leaves of transgenic Pro35S:LEC2:GR, Pro35S:TTG1:GR (negative control), or wild-type 10-d-old plants cultured in vitro on a medium with (+ DEX) or without (− DEX) 10−5 M DEX for two additional weeks, quantified by RT-qPCR, and presented as percentage of the EF1αA4 (EF) gene expression. Values are the means and se of three to four replicates performed on three independent cDNA preparations.
(Q) Time-course analysis of MYB115 mRNA accumulation in leaves of 10-d-old Pro35S:LEC2:GR plants transferred to a growth medium containing 10−5 M DEX (induction) and grown for 2 weeks in vitro. Accumulation of mRNA was determined by RT-qPCR and presented as the percentage of the EF1αA4 (EF) gene expression. Values are the means and se of three to six replicates performed on three independent cDNA preparations.
(R) Transgenic ProMYB115:uidA × Pro35S:LEC2:GR seedlings were transferred 10 d after germination on a DEX-containing medium (10−5 M; + DEX). Rosette leaves were analyzed 2 weeks after induction. For histochemical detection of GUS activity, tissues were incubated overnight in a buffer containing 0.2 mM each of potassium ferrocyanide and potassium ferricyanide. Bars = 0.2 cm.
(S) Accumulation of MYB115 mRNA in myb118 mutant seeds (myb118-1 and OE3) was quantified 10 DAA by RT-qPCR and presented as the percentage of the EF1αA4 (EF) gene expression. Values are the means and se of three replicates performed on cDNA dilutions obtained from three independent mRNA extractions. OE3, Pro35Sdual:MYB118 transgenic line exhibiting a strong repression of MYB118 expression (Barthole et al., 2014); WT, wild type (Col-0). Asterisks indicate significant difference from the wild type according to t test at ***P < 0.001 and **P < 0.01, respectively.

