
Figure 6. Methylglyoxal (MGO)-induced neurotoxicity is sensed and rescued through a conserved mechanism.
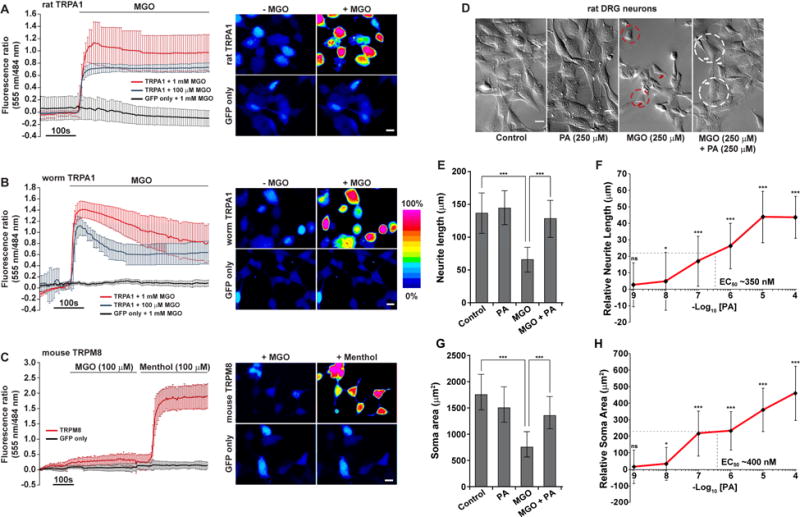
Fluorescence ratio (555/484 nm) changes for the membrane-permeable Ca+2 indicator Rhod-3 AM (left) and representative Rhod-3 AM images (Scale bar is 10 μm) in pseudo color scale (right) for HEK293 cells transfected with
(A) TRPA1 (RAT) and GFP or GFP only. Cells were treated with 100 μM or 1 mM MGO and images captured before (−MGO) or 100 s after 100 μM MGO application. n ≥6.
(B) TRPA1 (worm) and GFP or GFP only, treated and imaged as in Fig. 6a. n ≥5.
(C) TRPM8 (mouse) and GFP or GFP only. Cells were treated with 100 μM MGO first and then switched to 100 μM menthol. Images were captured after 100 s of incubation with MGO and menthol. n=9.
(D) DIC images for differentiated 50B11 cells (immortalized rat DRG neuronal cells) treated with ethanol (control), podocarpic acid/PA (250 μM), MGO (250 μM), or a combination of PA and MGO (each at 250 μM). Shrinkage in cell bodies (red dotted circles), retraction in neurite outgrowth (red arrows) and diminished neuronal networking is visible in MGO (only)-treated cells. Amelioration of size of the cell bodies (white dotted circle) and length of neurite outgrowth emerging from the edge of the soma (white arrows) due to PA treatment. Scale bar 50 μm.
(E–F) Neurite length and
(G–H) soma size quantification in rat DRG neuronal cells, treated with water (control), PA (various concentrations), 250 μM MGO, and 250 μM of MGO and PA (various concentrations). For dose response figures, the individual data points are presented relative to MGO (250 μM) measurements. PA concentration is 250 μM in (E) and (G).
Data are represented as mean ± SD. Significance: *P<0.05, **P<0.005 and ***P<0.0005.
See also Figure S6.