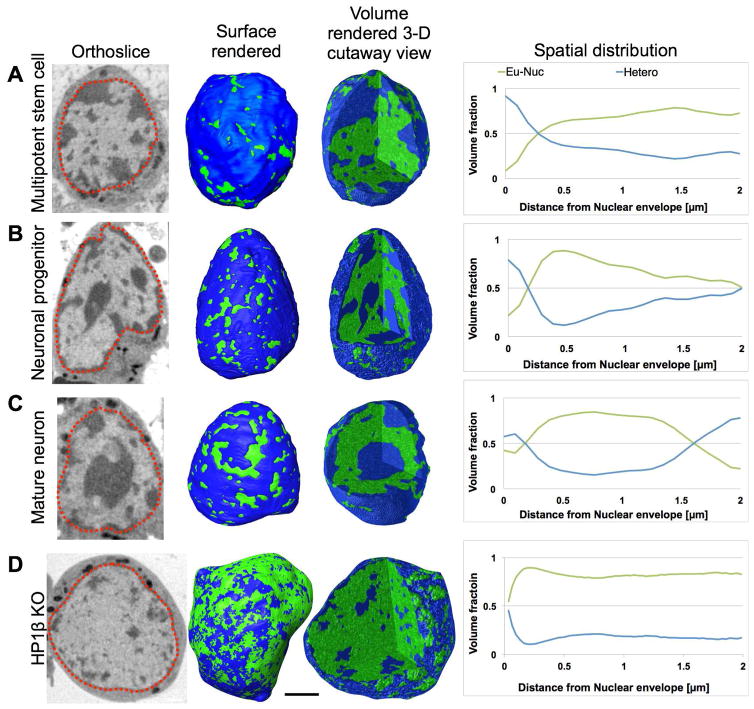
Figure 4. Spatial distribution of chromatin.
Distribution of chromatin in a multipotent stem cell (A), neuronal progenitor (B), mature olfactory sensory neuron (C), and Hp1β KO mature neuron (D) seen in orthoslices (virtual sections) from the tomographic reconstructions and segmented views of the nuclei, both surface rendered and 3D cutaway volume rendered views, color-coded to represent heterochromatin (blue) and euchromatin (green). Plots showing the percent volume of heterochromatin (blue) and euchromatin (green) at increasing distances from the nuclear envelope quantify the reorganization of chromatin during differentiation (AC) and loss of heterochromatin in the Hp1β KO (D). Bar, 2 μm.

