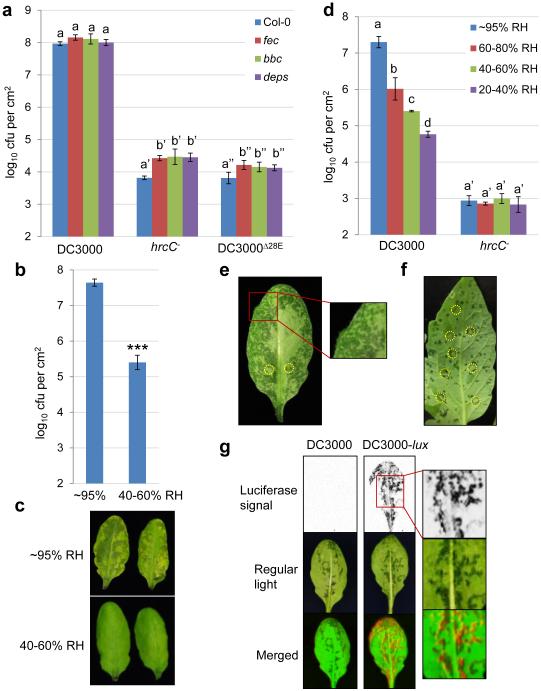
Figure 1.
Full-scale Pst DC3000 infection requires high humidity and is tightly associated with apoplast “water soaking”. See Methods for syringe-infiltration or dip-inoculation of plants described in all figures. a, Bacterial populations in Col-0, fls2/efr/cerk1 (fec), bak1-5/bkk1-1/cerk1 (bbc) and dde2/ein2/pad4/sid2 (deps) leaves 2 days post infiltration with bacteria at 1×10⁶ cfu/ml. Humidity: ~95%. Two-way ANOVA with Tukey’s test (p value set at 0.05) was performed. No significant differences were found for DC3000 populations in different plant genotypes (indicated by the same letter a), whereas differences were found for hrcC− or DC3000D28E populations in different plant genotypes, as indicated by different letters of the same type (a’ vs. b’ for hrcC− and a” vs. b” for DC3000D28E). n=4 technical replicates; error bars, mean±s.d. Experiments were repeated three times with similar results. b-c, Bacterial populations (b) and disease symptoms (c) 3 days post infiltration with Pst DC3000 at 1×10⁵ cfu/ml. * indicates a significant difference determined by Student’s t-test (two-tailed); ***, p=1.08×10⁻⁶. n=4 technical replicates; error bars, mean±s.d. Experiments were repeated four times with similar results. d, Bacterial populations in Col-0 leaves 3 days post infiltration with bacteria at 1×10⁵ cfu/ml. Statistical analysis was the same as in a. Significant differences were found for DC3000 populations under different humidities, as indicated by different letters (a, b, c and d). No significant differences were found in hrcC− populations (indicated by the same letter a’). n=3 technical replicates; error bars, mean±s.d. Experiments were repeated three times with similar results. e, Pictures of the abaxial sides of Col-0 leaves 24 h post infiltration with Pst DC3000 at 1×10⁶ cfu/ml. Humidity: ~95%. Dark spots on the leaf indicate water soaking spots. Red boxes indicate “zoomed-in” regions. f, Picture of a tomato leaf (cv. Castle Mart) 3 days after infiltration with Pst DC3000 at 1×10⁴ cfu/ml. Humidity: ~95%. Yellow circles in e and f indicate infiltration sites. Images were representative of water-soaked leaves from more than four plants. g, Col-0 plants were dip-inoculated with bacteria at 2×10⁸ cfu/ml. Humidity: ~95%. Bacterial colonies in inoculated leaves were visualized 2 days later by a charge-coupled device (upper panel) and pictures of leaves were taken to show water soaking spots (middle panel). Bottom panel shows merged images, with the artificial red color labeling Pst DC3000-lux bacteria. Experiments were repeated three times. Images were representative of leaves from more than four plants.

