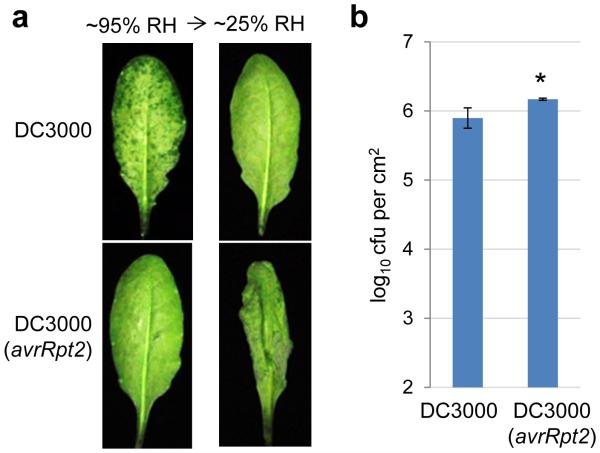
Extended Data Figure 5.
a, Col-0 leaves were syringe-infiltrated with Pst DC3000 (1×10⁶ cfu/ml) or Pst DC3000 (avrRpt2) (1×10⁷ cfu/ml). Plants were kept under high humidity (~95%) for 24 h to observe water soaking and then shifted to low humidity (~25%) for 2 h to observe ETI-associated tissue collapse. Pictures were taken before and after low humidity exposure (a) and bacterial populations were determined 24 h post infiltration to show similar population levels (b). * indicates a significant difference of bacterial population, as determined by Student’s t-test (two-tailed); *, p=0.033. n=3 technical replicates; error bars, mean±s.d. Experiments were repeated three times. This is an experimental replicate of Fig. 3b and 3c (without rps2).

