Extended Data Figure 3.
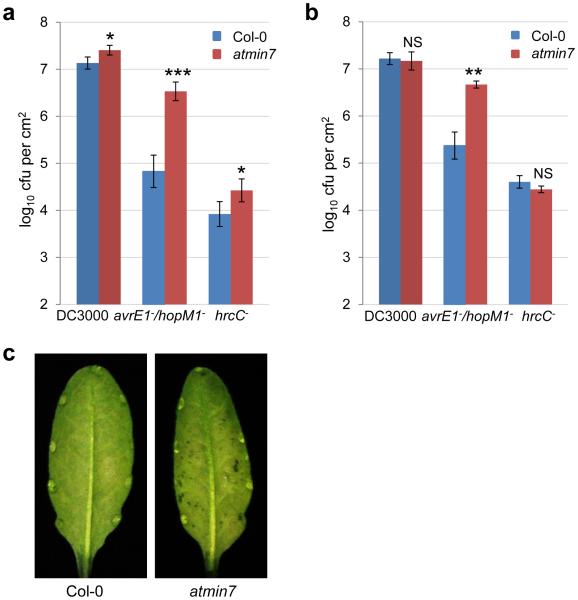
Bacterial multiplication and water soaking in Col-0 and the min7 mutant. a, The Col-0 and min7 plants were dip-inoculated with Pst DC3000, the avrE−/hopM1− mutant or the hrcC− mutant at 1×10⁸ cfu/ml. Bacterial populations were determined 4 days post inoculation. * indicates a significant difference between Col-0 and min7 plants, as determined by Student’s t-test (two-tailed); *, p=1.61×10⁻² and 3.12×10⁻² for DC3000 and hrcC−, respectively; ***, p=1.41×10⁻⁴ for avrE−/hopM1−. n=4 technical replicates; error bars, mean±s.d. Experiments were repeated three times. b-c, The Col-0 and min7 plants were syringe-infiltrated with Pst DC3000, the avrE− /hopM1− mutant or the hrcC− mutant at 1×10⁶ cfu/ml. Bacterial populations were determined 3 days post inoculation (b) and leaf pictures were taken 38 h after infiltration to show water soaking in min7 leaves (c). * indicates a significant difference between Col-0 and min7 plants, as determined by Student’s t-test (two-tailed); **, p=1.63×10⁻³ for avrE−/hopM1−; ns, not significant (p=0.72 and 0.14 for DC3000 and hrcC−, respectively). n=3 technical replicates; error bars, mean±s.d. Experiments were repeated three times. Images were representative of leaves from more than four plants.

