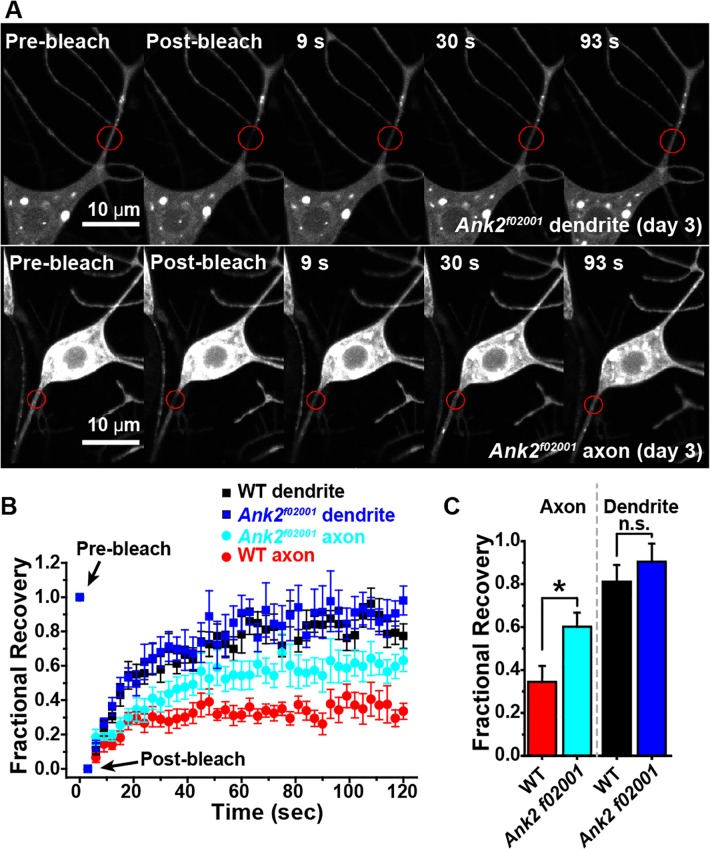
Fig 10. Disruption of the Ank2L exon compromises the axonal diffusion barrier.
A. Example images of dendrite and axon bleaching experiments in Ank2f02001 homozygous animals are shown. The fluorescent marker is mCD8-RFP as in Fig 7. B. Quantitation of FRAP experiments is shown. The control data is the 3-day dataset shown in Fig 7. This is the matched control for the Ank2f02001 mutants as the age of the animal, Gal4 driver and fluorescent marker are the same. N’s for the control are listed in the legend for Fig 7. For the mutant, FRAP was measured in dendrites of 9 cells and axons of 19 cells. C. The recovery plateau was quantitated by averaging values between 110 and 120 ms. Bars show mean ± SEM. and the asterisk indicates significant difference (p < 0.02, t-test).

