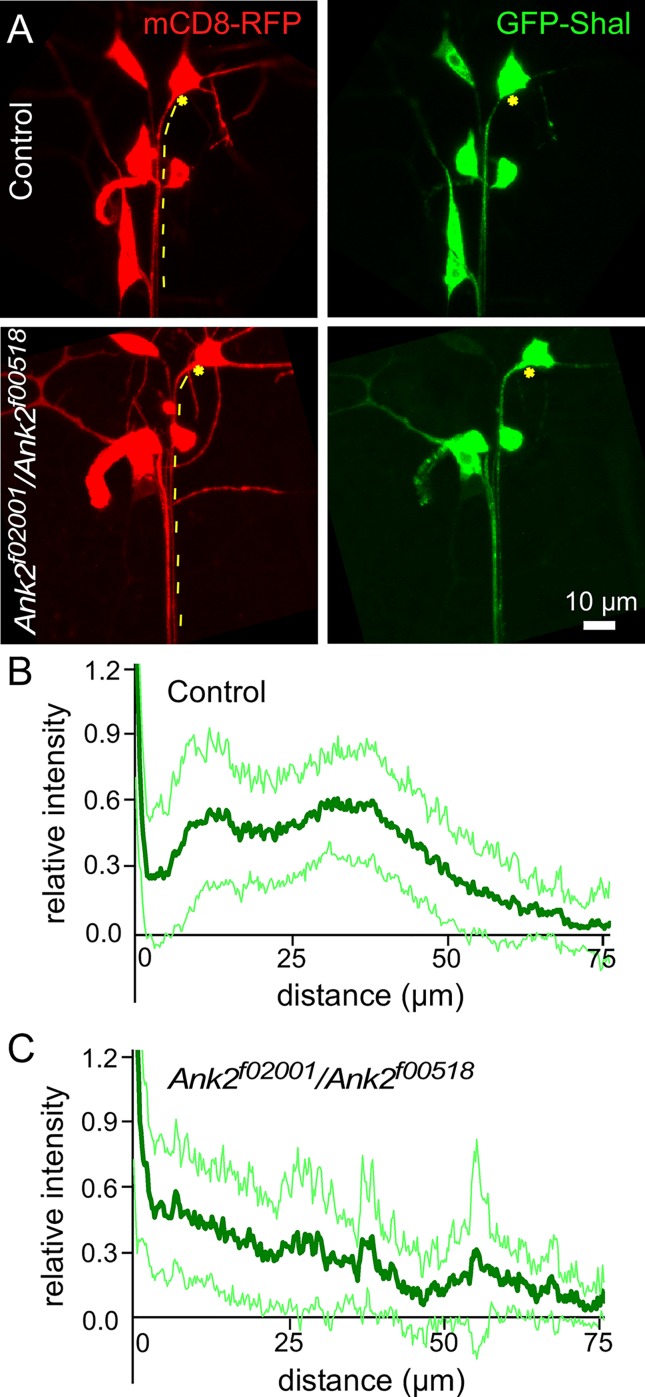
Fig 11. GFP-Shal patterning in the proximal axon depends on Ank2.
A. Examples of GFP-Shal localization in control or Ank2f02001/Ankf00518 are shown. mCD8-RFP was expressed to outline the cell. Stars mark the beginning of the axon and dashed lines trace the ddaE axon. B and C. Quantitation of GFP-Shal in control and of Ank2f02001/Ankf00518 neurons was performed by measuring the fluorescence intensity along the axon starting from the cell body until it was no longer possible to separate the signal in the ddaE axon from that of neighboring axons. Because of this overlap with other axons, n’s were not the same at all distances: n’s for the control group are 52, 52, 44, 32 at 0, 25, 50 and 75 microns away from cell body, and n’s The for the Ank2f02001/Ankf00518 group are 36, 29, 18, 8 at 0, 25, 50, 75 microns away from cell body. Scale bar = 10 microns. Average normalized fluorescence intensities are shown as the dark green line and the standard deviation is represented by the pale green surrounding lines.

