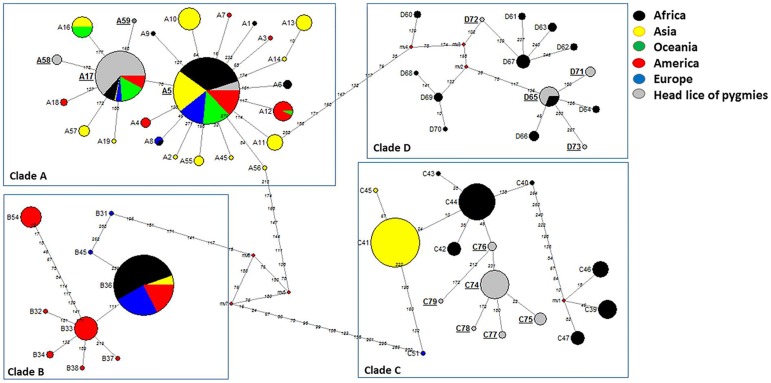
Fig 2. Cytb haplotype networks of human body and head lice. Each circle indicates a unique haplotype and variations in circle size are proportional to haplotype frequencies. Pie colors and sizes in circles represent the continents and the number of their sequence for a haplotype.
The length of the links between nodes is proportional to mutational differences. Haplotypes identified in the present study are in bold.

