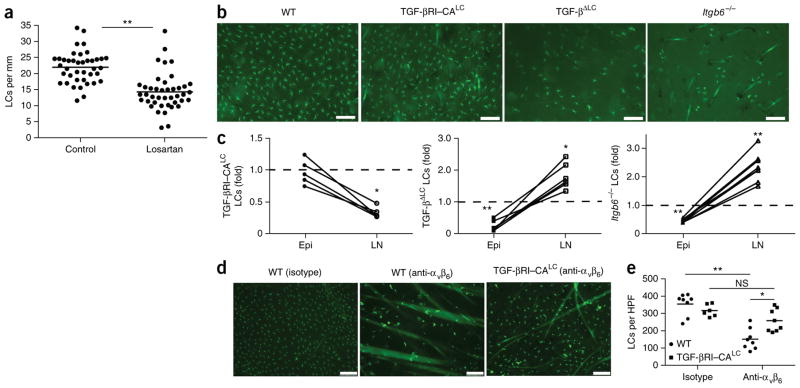
Figure 1.
Activation of latent TGF-β by αvβ6 inhibits homeostatic LC migration. (a) Quantification of LCs in archival skin specimens from untreated (control) and losartan-treated patients, detected by immunohistochemistry with antibody to CD1a (anti-CD1a) or anti-langerin. Each symbol represents an individual patient; horizontal lines indicate the average. (b) Microscopy of whole mounts of back epidermis from cohorts (n = 10 mice in each) of wild-type mice (WT), TGF-βRI–CALC mice (with inducible expression of constitutively active TGF-βRI in LCs) and TGF-βLC mice (with inducible ablation of TGF-β in LCs) 9 d after the start of tamoxifen treatment, as well as epidermis from adult Itgb6−/− mice, all stained for MHC class II (green). (c) Ratio of the number of LCs in the epidermis (Epi) (obtained by counting of the MHCII+ cells in b) or skin draining LNs (LN) (obtained by flow cytometry) of Itgb6−/−, TGF-βRI–CALC and TGF-βLC mice to that in their wild-type counterparts. Each symbol represents an individual mouse (with results from the same mouse joined by a solid line); dashed horizontal lines indicate a ratio of 1.0. (d) Microscopy of whole mounts of ear epidermis from tamoxifen-treated wild-type and TGF-βRI–CALC mice given intradermal injection of anti-αvβ6 or isotype-matched control antibody (Isotype) (n = 4 mice per genotype per group), stained for MHC class II (green). (e) Quantification of LCs per high-power field (HPF) in the mice in d. Each symbol represents LCs per HPF; small horizontal lines indicate the average. Scale bars (b,d), 100 μm. NS, not significant (P > 0.05); *P < 0.01 and **P < 0.0001 (two-tailed unpaired Student’s t test (a,c) or Tukey’s multiple comparisons test (e)). Data are representative of experiments with n = 42 total donors (a) or are representative of (b,d) or pooled from (c,e) three independent experiments.

