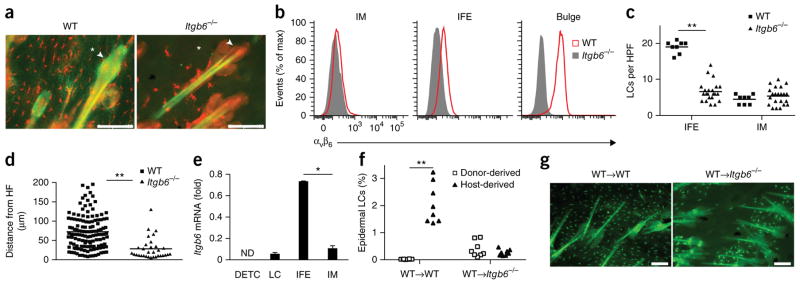
Figure 2.
Epidermal residence of LCs requires expression of αvβ6 by IFE epidermal KCs. (a) Microscopy of whole mounts of back epidermis from wild-type and Itgb6−/− mice, stained for MHC class II (red) and αvβ6 (green); arrowheads indicate bulge region of telogen hair; asterisks indicate IFE region. (b) Flow cytometric analysis of the expression of αvβ6 by IM, IFE and bulge KCs (identified as in Supplementary Fig. 3b) from the back skin of wild-type and Itgb6−/− mice (key). (c) Quantification of LCs in transverse sections of back skin from wild-type and Itgb6−/− mice, identified by colocalization of langerin and MHC class II within the IFE region or IM. (d) Distance of IFE LCs from the hair follicle (HF) in sections as in c. (e) Quantitative RT-PCR analysis of Itgb6 mRNA in sorted epidermal populations of dendritic epidermal T cells (DETC), LCs, and IFE and IM KCs in wild-type mice; results are presented relative to those of the control gene Hprt. (f) Frequency of host- and donor-derived epidermal LCs in lethally irradiated wild-type→wild-type (WT→WT) or wild-type→Itgb6−/− (WT→Itgb6−/−) (CD45.2+) chimeras 6–8 weeks after transfer of BM from wild-type (CD45.1+) donors, analyzed by flow cytometry. (g) Microscopy of whole mounts of back epidermis from chimeras as in f, stained for MHC class II (green); autofluorescence shows hair shafts. Scale bars (a,g), 100 μm. ND, not detected. Each symbol (c,d,f) represents LCs per HPF (c), distance from HF (d) or an individual mouse (f); small horizontal lines indicate the mean. *P < 0.01 and **P < 0.0001 (two-tailed unpaired Student’s t test). Data are representative of three independent experiments with eight mice per genotype (a,b,g) or six independent experiments (e; mean + s.e.m.) or are pooled from two independent experiments with two mice per group (c,d) or three independent experiments (f).

