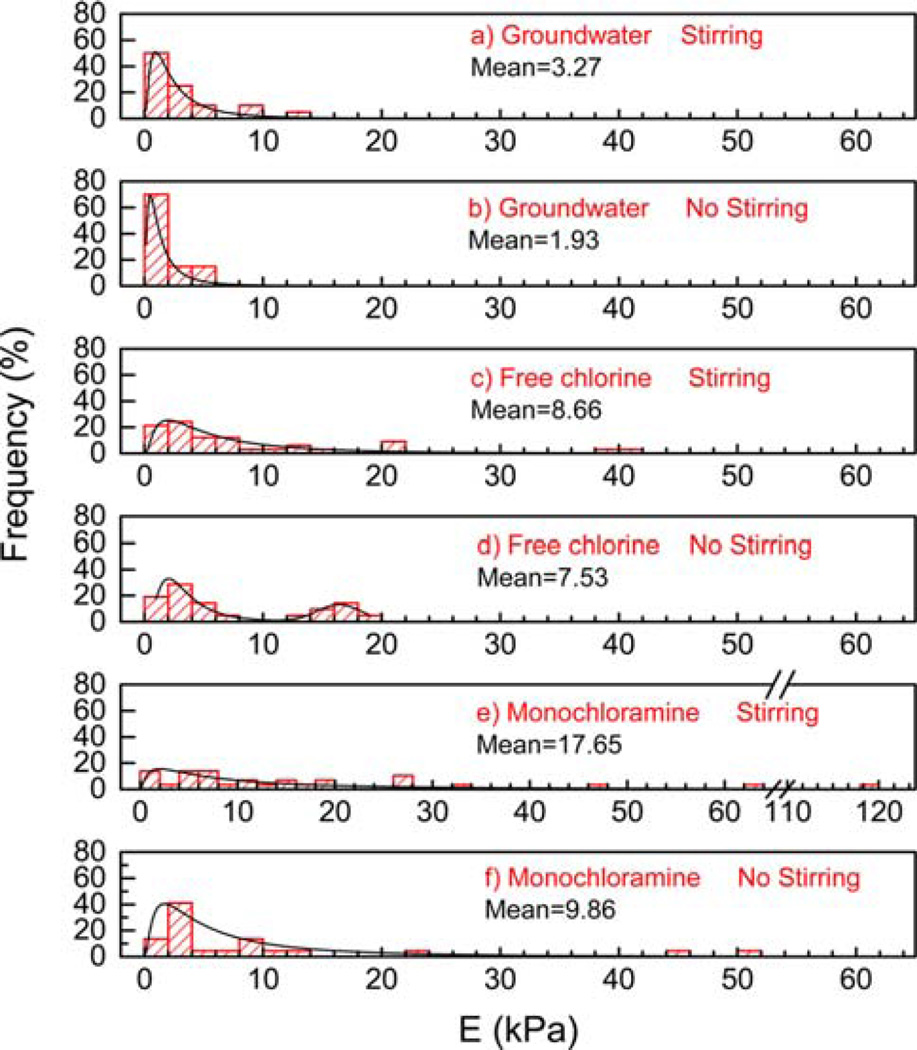
Figure 3.
Frequency distribution of E for biofilm after 3 months exposure of groundwater (a) with and (b) without stirring, free chlorine (c) with and (d) without stirring, and monochloramine (e) with and (f) without stirring, respectively. The Y-axis represents the frequency of occurrences of E values with each interval size of 5 kPa.

