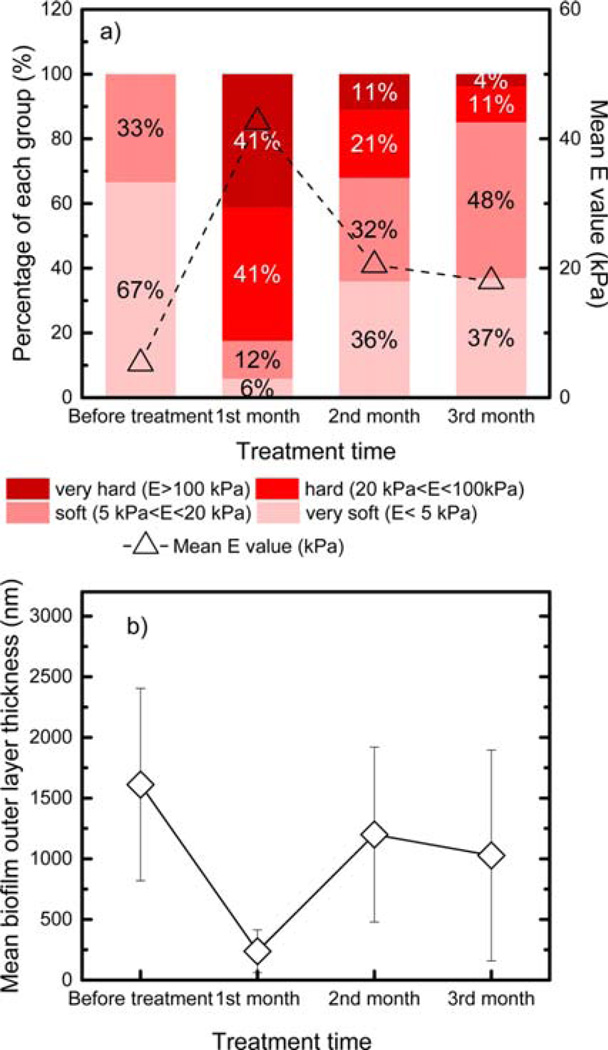
Figure 4.
(a) The percentage stacked bar for the Young modulus and (b) the outer layer thickness of biofilms during the three months of monochloramine treatment under stirring conditions. The red line in panel a shows the mean value of E at each time point. The percentage stacked bars and outer layer thicknesses of biofilms during other treatment conditions are shown in Figure S1 (free-chlorine treatment under stirring conditions), Figure S2 (monochloramine treatment under nonstirring conditions), and Figure S3 (free-chlorine treatment under nonstirring conditions).

