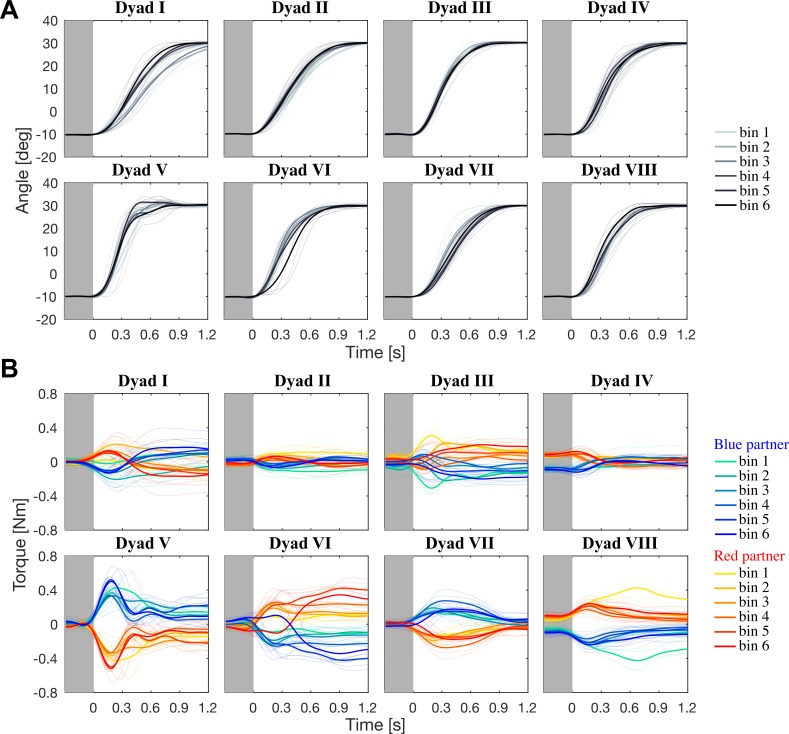
Fig 2. Trajectory and torque data for the coupled block.
(A) Trajectories of the average cursor for all dyads in the coupled block. The bold lines indicate the average trajectory of each bin; the thin lines show the individual trials. (B) Torque from all eight dyads, where each bold trace corresponds to the average of each bin; the bins progress chronologically from green to blue for the blue partner and from yellow to red for the red partner. With the exception of dyad VIII, no consistent trial-by-trial change in the torque was observed within dyads. Different dyads displayed specific torque patterns.

