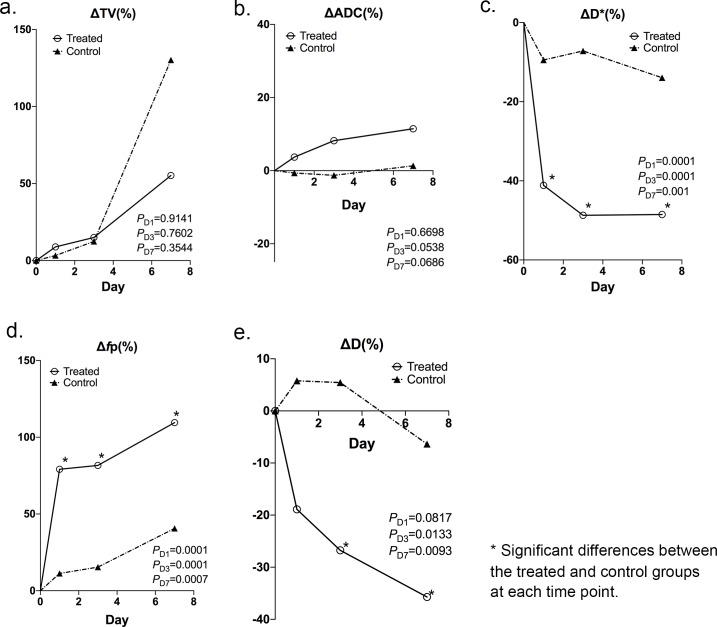
Fig 2. Median percentage changes at each time point for control and treated group.
Median percentage changes at each time point (days 1, 3 and 7) compared with baseline for (a) ΔTv (tumor volume), (b) ΔADC (apparent diffusion coefficient), (c) ΔD* (fast diffusion coefficient), (d) Δfp (fast fractional volume), (e) ΔD (slow diffusion coefficient) of all mice in the treated group (solid line) and control group (dashed line), respectively.

