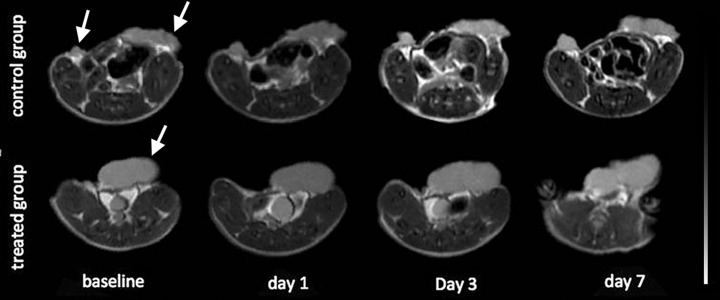
Fig 3. Tumor volume of representative mice for control and treated group.
Axial T2W images of a representative mouse in the control group (first row) and a mouse in the treated group (second row, the second tumor of this mouse was out of plane) at time points before (baseline) and after treatment (days 1, 3 and 7). No obvious changes in tumor volume were observed throughout the 7 days post-treatment in both groups.

