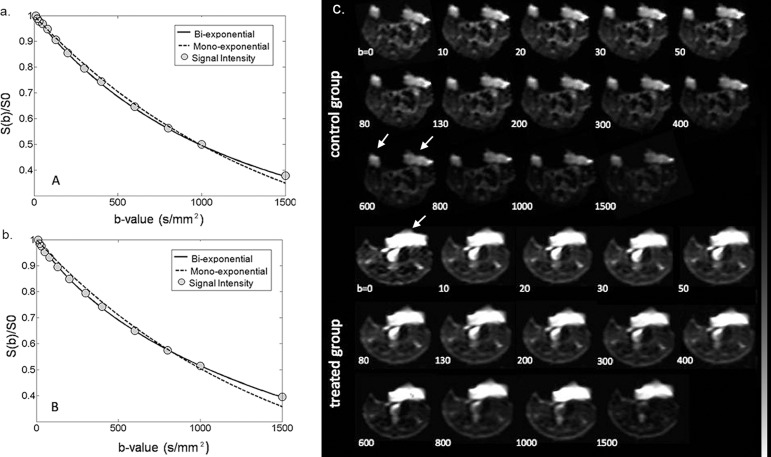
Fig 4. The averaged signal intensity decay and representative IVIM DW images.
The averaged signal intensity decay within (a) a treated tumor ROI and (b) a control tumor ROI. Each as a function of a b-value, are plotted on day 1 using both mono-exponential and bi-exponential models. For the treated mouse, D* = 1.02×10⁻³mm2/sec, fp = 41.6% and ADC = 0.70×10⁻³ mm2/sec. For the control mouse, D* = 2.53×10⁻³mm2/sec, fp = 14.5% and ADC = 0.68×10⁻³ mm2/sec. (c) IVIM DW images acquired at increasing b-values in a representative mouse of the treated group and a mouse of the control group.

