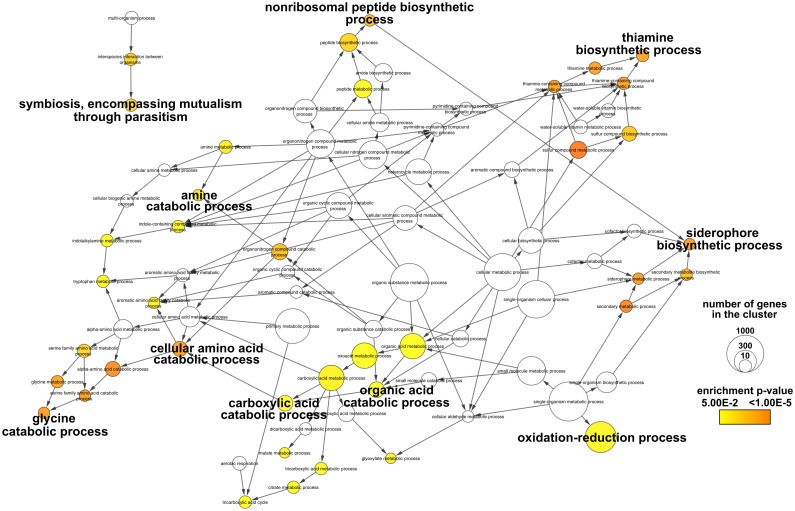
Fig 1. GO enrichment analysis of the up-regulated differentially expressed genes from ΔefpR mutant compared to the WT strain.
Colors of the GO terms correspond to the significance of the p-value. The size of the node is proportional to the number of genes classified in the GO terms. We highlighted the main GO terms significantly enriched.

