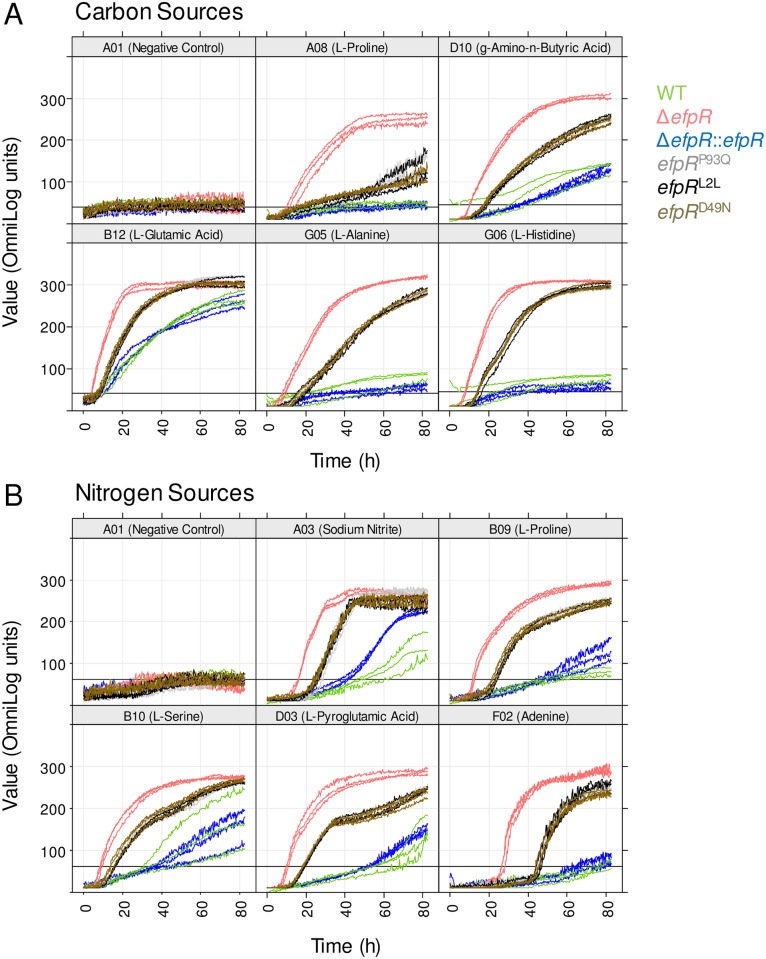
Fig 3. Phenotypic microarray curves for the ΔefpR mutant and the efpR allelic mutants compared to the WT strain.
Phenotype Microarray data were collected over 82.5 hours at a temperature of 28°C on the Biolog plates PM01, PM02 and PM03. The respective curves from all six strains are superimposed. The x-axes show the measurement times in hours, the y-axes the curve heights in OmniLog units. In the caption of each panel the corresponding coordinate of the well is shown followed by the (A) carbon or (B) nitrogen source tested. Three replicates were performed. Data were treated with the R package opm.

