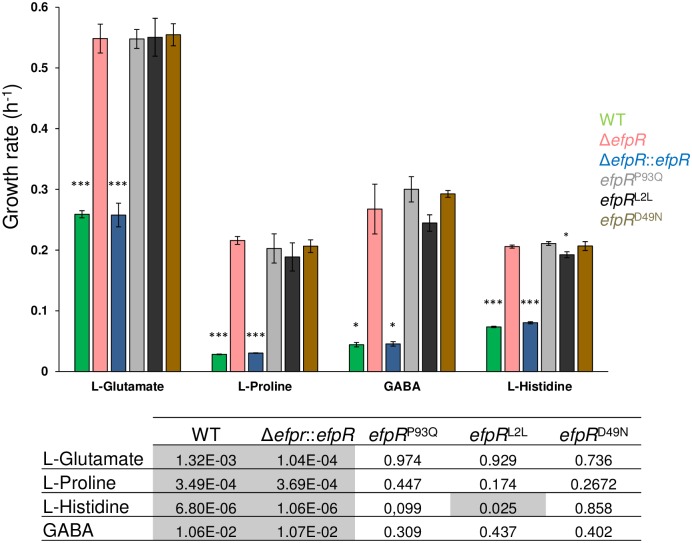
Fig 4. In vitro growth rate of R. solanacearum strains cultured in minimal medium supplemented with L-Glutamate, L-Proline, GABA or L-Histidine as sole carbon source.
The bacterial growth (under shaking) has been followed during 50h by measurement of OD600nm and then the growth rate determined during the exponential growth phase. Bars indicate standard deviation (Welch t-test, comparison with the ΔefpR strain, * p-value <0.05, ***p-value <0.001). The table gives the p-values from the Welch t-test comparing the growth rate of each tested strain with the growth rate of the ΔefpR strain.

