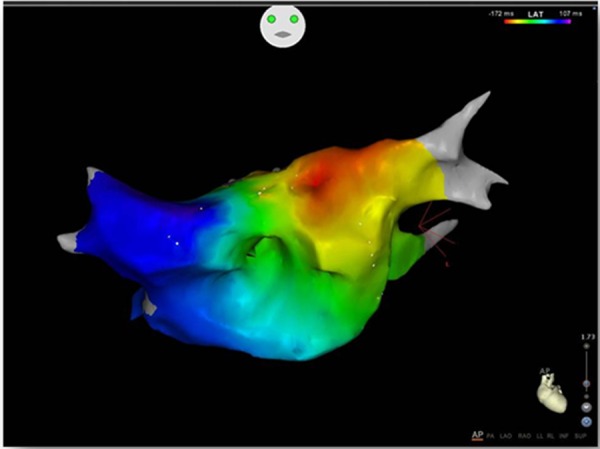
Figure 2. Activation map of an atrial tachycardia depicted on a left atrial geometry created with the FAM tool of CARTO3® (anteroposterior view). The color-coded scale visualizes earlier activated regions (red/yellow color) in comparison to later activated (green/blue color) areas. In this case, an atrial focus is postulated at the roof of left atrium, adjacent to the left upper pulmonary vein.

