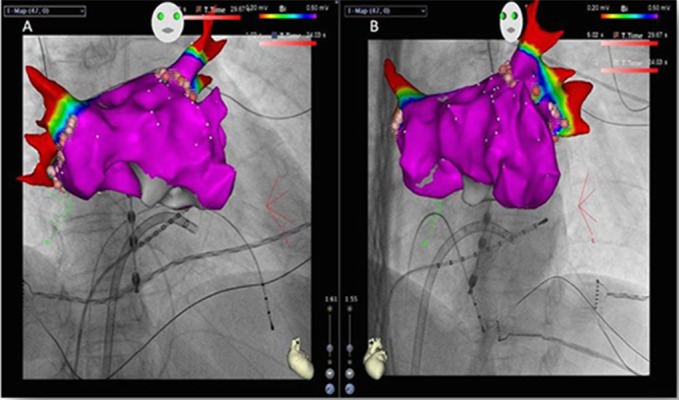
Figure 8. Left atrial reconstruction created with CARTO UniVu,® RAO and LAO projections. Following registration of the x-ray system to the EAMS, multiple fluoroscopy snapshots can be recorded. The reconstructed 3D model is then projected and auto-registered into the fluoroscopic environment. In this example, a 3D voltage map has been created. Red color indicates areas with absence of signals due to low-voltage/scar. In this case, no potentials are found within the pulmonary veins after wide atrial isolation. Purple color indicates areas of ‘healthy’ left atrium with voltage amplitudes above 0.5 mV.

