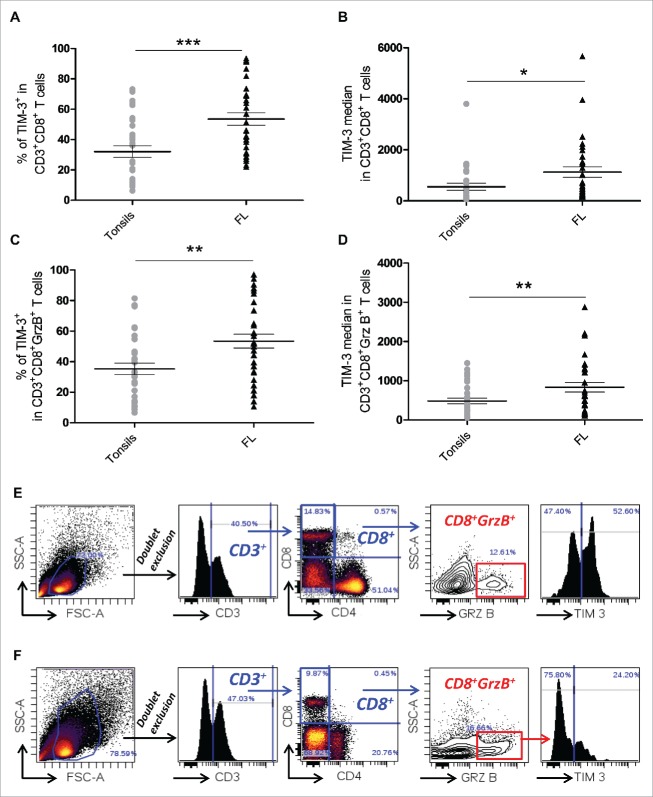
Figure 1.
TIM-3 is highly expressed in both CD8+ and CD8+GrzB+tumor-infiltrating T cells in FL lymph nodes. Percentage of CD3+CD8+TIM-3+ T cells (A) and TIM-3 median fluorescence intensity (B) in CD3+CD8+ T cells from FL nodes (n = 33) and tonsils (n = 29). Percentage of CD3+CD8+GrzB+TIM-3+ T cells (C) and TIM-3 median fluorescence intensity in TIM-3+ CTL cells (D) in FL nodes and tonsils. Example of the gating strategy used and representative histogram of TIM-3 expression in CD8+GrzB+ in FL lymph nodes (E) and in tonsils (F). Unpaired Student's t-test using the GraphPad Prism software (version 6; GraphPad) was used to determine the statistical significance of differences between the groups. p = 0.0002 (A); p = 0.0164 (B); p = 0.0015 (C); p = 0.0078 (D).

