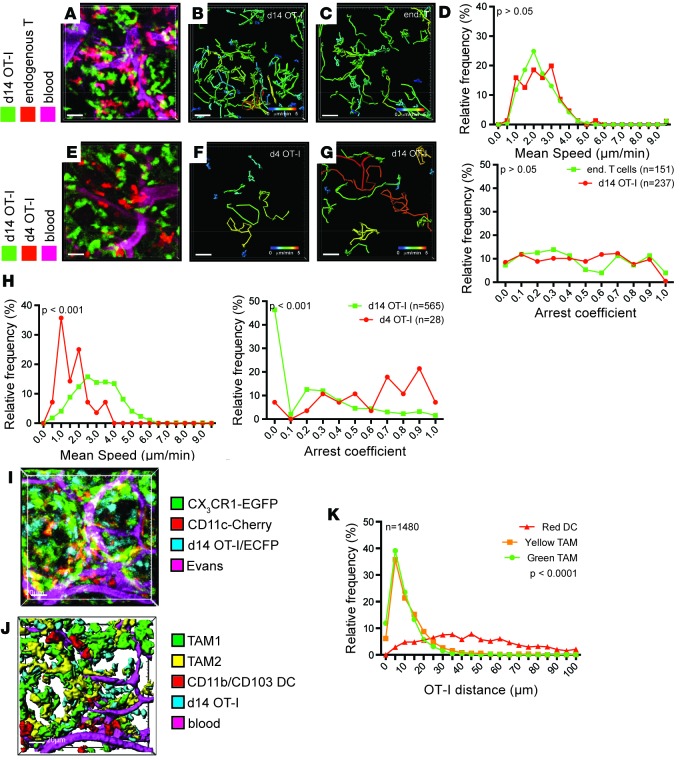
Figure 2. Exposure to tumor environment alters T cell behavior.
(A–D) Migration parameters of tumor-resident high-affinity T cells compared with endogenous T cells. (A–C) Representative video snapshot and migratory paths of high-affinity T cells and endogenous T cells, color-coded for mean track speed over 2 hours. (D) Kolmogorov-Smirnov analysis of the distribution of average migration speed and arrest coefficients. Data are representative of 5 experiments. (E–H) Comparison of migration parameters of high-affinity T cells upon recent arrival to tumors (red) and after establishing residence (green) within the same animal. (E–G) Representative video snapshot and migratory paths of high-affinity T cells upon recent arrival to tumors and after establishing residence, color-coded for mean track speed over 2 hours. (H) Kolmogorov-Smirnov analysis of the distribution of average migration speed and arrest coefficients. Data are representative of 5 experiments. (I) Snapshot and rendering (J) of the localization of high-affinity T cells (blue), CD11b+ TAM1 macrophages (green), CD11c+ TAM2 macrophages (yellow), and dendritic cells (red) 14 days after transfer of OT-I/CFP T cells into PyMT-ChOVA/CX3CR1-EGFP/CD11c-RFP transgenic hosts. Blood vessels were labeled by Evans Blue. (K) Representative statistical analysis of the distance of OT-I T cells to the next available APC using a Kruskal-Wallis 1-way ANOVA test. Data are representative of 2 experiments, n denotes the numbers of T cells analyzed. Scale bars: 20 μm.

