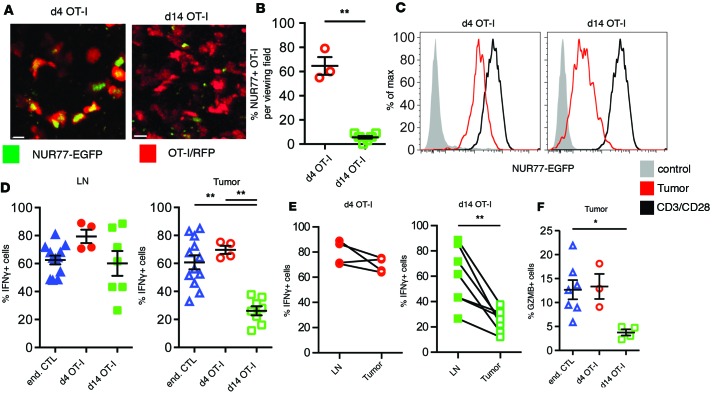
Figure 3. Reduced TCR signaling and effector function in tumor-specific T cells.
(A) Representative images of OT-I/CD2-RFP/NUR77-EGFP reporter T cells after arrival and after establishing residence in tumors. Scale bars: 10 μm. (B) Statistical analysis of the percentage of NUR77-positive T cells in PyMT-ChOVA tumors using a Mann-Whitney t test, **P < 0.01. Data are analyzed from multiple tumors analyzed from 2 animals. (C) Analysis of the NUR77-EGFP reporter activity in OT-I T cells isolated from tumors (red). In vitro–activated T cells cultured for 24 hours on CD3/CD28-coated plates serve as positive control (black). OT-I/NUR77-EGFP T cells isolated from spleens of naive mice serve as negative control (filled gray histogram). Data are representative of at least 3 experiments. (D–F) Analysis of cytokine expression by ex vivo–restimulated CD44hi endogenous CD8+ T cells and OT-I T cells at different time points after adoptive transfer. (D) Cytokine expression in tumor-draining lymph nodes and tumors of PyMT-ChOVA animals. Statistical analysis was performed using a 1-way ANOVA Kruskal-Wallis test. (E) Comparison of cytokine expression in tumor-draining lymph nodes and their corresponding tumors. Samples were analyzed using the Wilcoxon matched-pairs rank test. (F) Granzyme B expression in tumor-resident T cells. Statistical analysis was performed using a 1-way ANOVA Kruskal-Wallis test, *P < 0.05, **P < 0.01.

