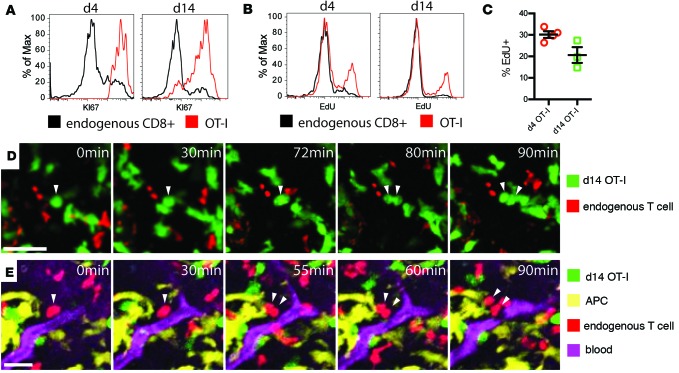
Figure 4. Tumor-resident T cells proliferate in the tumor microenvironment.
(A and B) Expression of KI67 (A) and incorporation of EdU during DNA synthesis within 24 hours (B) in endogenous CD44hi CD8+ T cells (black), or high-affinity T cells (red), after arrival of OT-I T cells to the tumor (left) and after establishing residence (right). (C) Statistical analysis of EdU incorporation in several experiments. Mann-Whitney test, P > 0.05. (D and E) Snapshots of time-lapse videos of dividing high-affinity T cells (D, green) and endogenous T cells (E, red) in tumors of PyMT-ChOVA/CD2-RFP hosts. (E) CD11c+ antigen-presenting cells (APC, yellow) are visualized by the expression of an additional CD11c-YFP transgene, and blood vessels are labeled by Evans Blue (magenta). Arrows show dividing T cells and their daughter cells. Scale bar: 20 μm.

