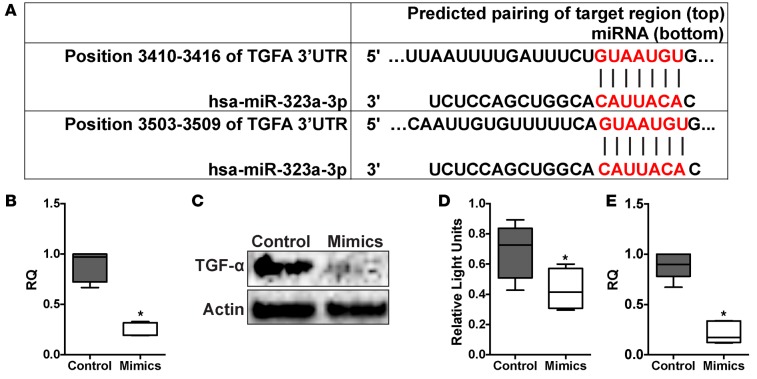
Figure 5. miR-323a-3p targets and suppresses TGFA signaling.
(A) miR-323a-3p bindings sites in the TGFA 3′ UTR. (B) qPCR, n = 6, *P < 0.0001 and (C) Western blot for TGFA from 16HBE14o- cells transfected with miR-323a-3p mimics or control. A representative blot is presented from 3 individual experiments. (D) Luciferase activity of HEK cells transfected with a reporter plasmid containing a chimeric firefly luciferase with the TGFA 3′ UTR. All data were normalized to Renilla luciferase activity. n = 3, *P < 0.05. (E) 16HBE14o- cells transfected with miR-323a-3p mimetic or control were processed for MMP9 PCR. n = 3, *P < 0.005. Data are presented as box-and-whisker plots. The central horizontal bars indicate the medians, boxes indicate 25th to 75th percentiles, and whiskers indicate 1.5 times the interquartile range from the bottom and the top of the box. Statistical analysis in this figure was performed with the Student’s t test. RQ, relative quantification.

