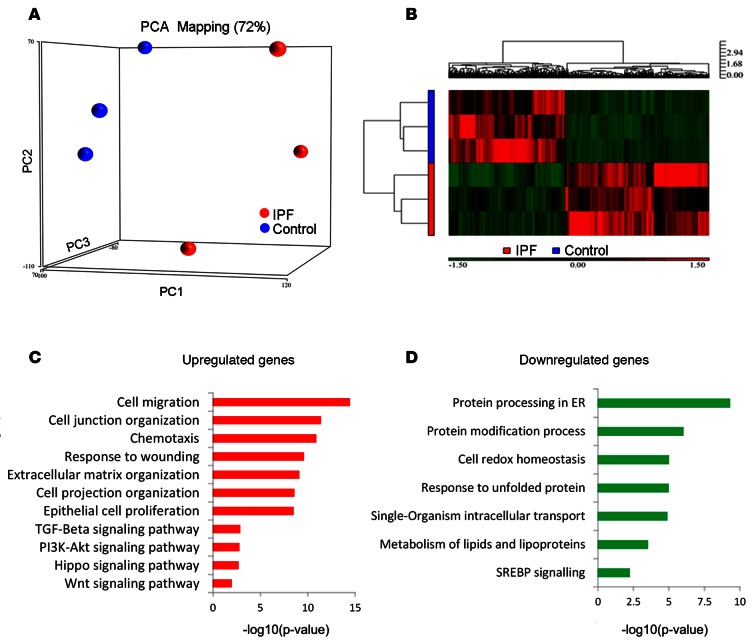
Figure 1. Heatmap, principal component analysis, and predicted function in sorted normal and IPF epithelial cells.
EPCAM+ (CD326+) and HTII-280+ epithelial cells from control and IPF donors were isolated from peripheral lung tissue by FACS and subjected to RNA sequencing (RNA-seq). (A) Principal component analysis (PCA) RNA-seq data from IPF and control donors (n = 3 per group) shows the primary separation of samples by disease status. (B) Heatmap represents 2D hierarchical clustering of genes and samples and shows differentially expressed genes in IPF versus control samples. (C) Functional enrichment of predicted biological processes and genes induced in IPF is shown. (D) Functional enrichment of predicted biological processes and genes suppressed in IPF is shown. x axis represents the –log10 transformed enrichment P value

