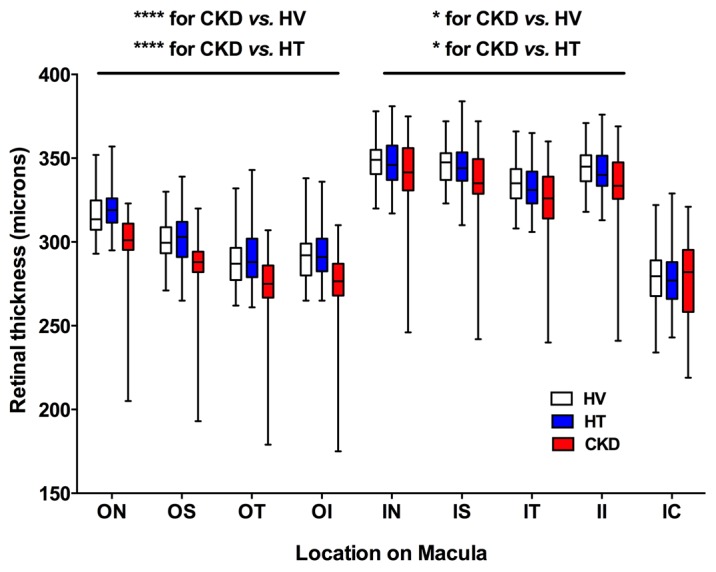
Figure 2. Retinal thickness as a function of macular location.

Box-and-whisker plots showing retinal thickness in subjects with hypertension (HT), chronic kidney disease (CKD), and healthy volunteers (HV) across different areas of the macula (see Figure 1A): ON, outer nasal; OS, outer superior; OT, outer temporal; OI, outer inferior; IN, inner nasal; IS, inner superior; IT, inner temporal; II, inner inferior; IC, inner circle. At each of the 4 locations ON, OS, OT, and OI, ****P < 0.0001 for CKD vs. healthy and for CKD vs. hypertensive subjects. At each of the 5 locations IN, IS, IT, II, IC, *P < 0.05 for CKD vs. healthy and for CKD vs. hypertensive subjects. The box-and-whisker plots display the first and third quartiles, with the line within the box representing the median value. The whiskers denote the minimum and maximum values. Thicknesses were examined by 2-way ANOVA, comparing thicknesses between all 3 patient groups at each macular location using Tukey correction for multiple comparisons. n = 50 subjects per group.
