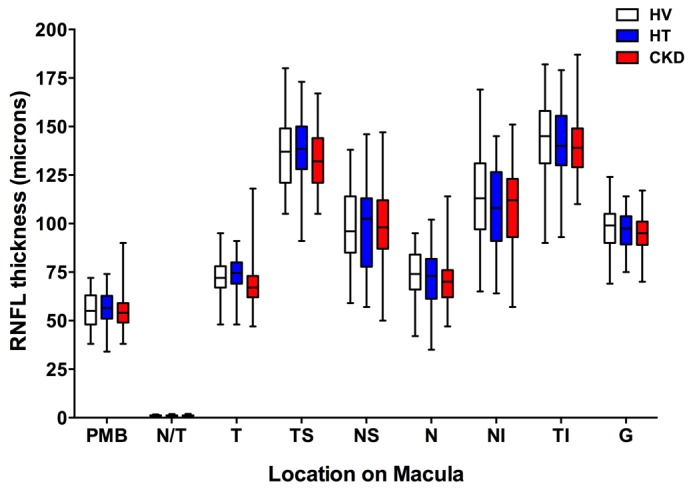
Figure 4. Retinal nerve fiber thickness vs.

macular location. Box-and-whisker plots showing retinal nerve fiber layer (RNFL) thickness in subjects with hypertension (HT), chronic kidney disease (CKD), and healthy volunteers (HV) across different areas of the macula: T, temporal; TS, temporal-superior; NS, nasal-superior; N, nasal; NI, nasal-inferior; TI, temporal-inferior. PMB, papillo-macular bundle; N/T, nasal-temporal ratio; G, average RNFL thickness. The box-and-whisker plots display the first and third quartiles, with the line within the box representing the median value. The whiskers denote the minimum and maximum values. Thicknesses were examined by 2-way ANOVA, comparing thicknesses between all 3 patient groups at each macular location using Tukey correction for multiple comparisons. n = 50 subjects per group.
